
Advertisement
Advertisement
E-mini NASDAQ-100 Index (NQ) Futures Technical Analysis – December 28, 2017 Forecast
By:
Based on the early price action, the direction of the NASDAQ-100 Index today will be determined by trader reaction to the downtrending Gann angle at 6449.75.
March E-mini NASDAQ-100 Index futures are trading higher early Thursday. Yesterday, the index posted an inside move on extremely low volume. The move suggests investor indecision and impending volatility.
Daily Technical Analysis
The main trend is up according to the daily swing chart, however, momentum has been trending lower since the formation of a closing price reversal top on December 19 and the subsequent follow-through break.
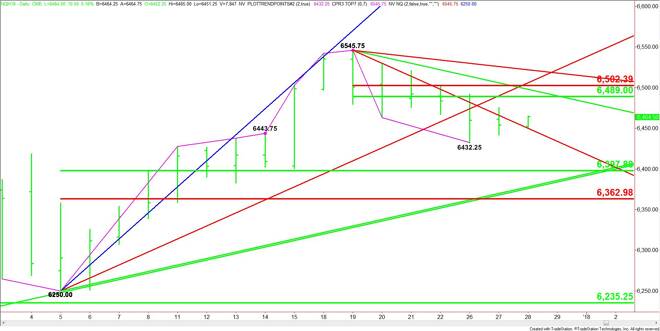
A trade through 6545.75 will negate the closing price reversal top and signal a resumption of the uptrend. A move through 6432.25 will indicate the selling is getting stronger.
The main range is 6250.00 to 6545.75. Its retracement zone at 6397.75 to 6363.00 is the primary downside target. Since the main trend is up according to the swing chart, we could see a technical bounce on the first test of this zone. Additional support targets are a pair of uptrending Gann angles at 6378.00 and 6377.50.
The short-term range is 6545.75 to 6432.25. A rally today could drive the market into its retracement zone at 6489.00 to 6502.50. This zone is very important to the chart pattern. If the trend is getting ready to turn down then sellers will show up on a test of this zone. Inside this zone is a downtrending Gann angle at 6491.75.
Daily Technical Forecast
Based on the early price action, the direction of the NASDAQ-100 Index today will be determined by trader reaction to the downtrending Gann angle at 6449.75.
A sustained move over 6449.75 will indicate the presence of buyers. This could create the upside momentum needed to trigger a rally into the short-term 50% level at 6489.00, a short-term downtrending Gann angle at 6491.75 and the short-term Fibonacci level at 6502.50.
A sustained move under 6449.75 will signal the presence of sellers. This could trigger an acceleration into this week’s low at 6432.25. This is the trigger point for another steep break into the major 50% level at 6397.75, followed by angles at 6378.00 and 6377.50, and the major Fib level at 6363.00.
Be careful buying strength and selling weakness due to expectations of low pre-holiday volume.
About the Author
James Hyerczykauthor
James Hyerczyk is a U.S. based seasoned technical analyst and educator with over 40 years of experience in market analysis and trading, specializing in chart patterns and price movement. He is the author of two books on technical analysis and has a background in both futures and stock markets.


Advertisement