Advertisement
Advertisement
E-mini NASDAQ-100 Index (NQ) Futures Technical Analysis – June 26, 2017 Forecast
By:
September E-mini NASDAQ-100 Index futures are trading sharply higher shortly ahead of the cash market opening. Stocks are reacting positively to firmer
September E-mini NASDAQ-100 Index futures are trading sharply higher shortly ahead of the cash market opening. Stocks are reacting positively to firmer crude oil prices, but gains have been capped by weaker-than-expected U.S. Durable Goods. The NASDAQ is also getting a boost from higher closes in Asia and Europe.
Technical Analysis
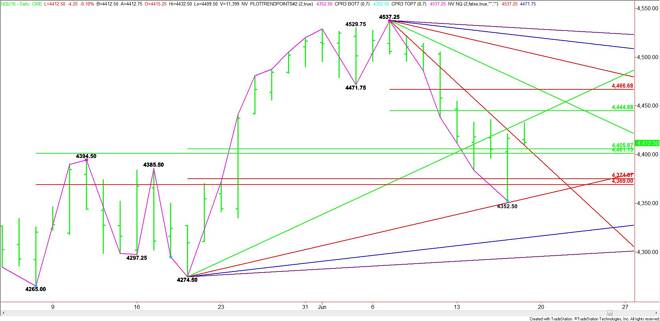
The main trend is up according to the daily swing. The market is picking up where it left off last week when it changed the main trend to up following a two-week setback.
If the upside momentum then buyers will target the main top at 5907.50 over the near-term. The index isn’t close to turning the main trend to down, but it is in the window of time for a potentially bearish closing price reversal top.
The main range is 5907.50 to 5641.25. The market is trading on the bullish side of its retracement zone at 5805.75 to 5774.25, helping to support its upside bias.
Forecast
Based on the current price at 5842.00, the index is likely to open with enough upside momentum to challenge the price cluster at 5863.50 to 5865.25. We could see a technical bounce due to profit-taking on the first test of this area. Overtaking 5865.25 will put the index in a position to test the next downtrending angle at 5885.00. This is the last potential resistance angle before the 5907.50 main top.
The inability to challenge or overcome 5863.50 will signal the presence of sellers. This could trigger a pullback into a downtrending angle at 5819.50. Falling below this angle will indicate the selling is getting stronger with the next targets the Fibonacci level at 5805.75 and the 50% level at 5774.25.
Look for a bullish tone as long as the index remains over 5819.50.
About the Author
James Hyerczykauthor
James Hyerczyk is a U.S. based seasoned technical analyst and educator with over 40 years of experience in market analysis and trading, specializing in chart patterns and price movement. He is the author of two books on technical analysis and has a background in both futures and stock markets.
Advertisement
