
Advertisement
Advertisement
E-mini NASDAQ-100 Index (NQ) Futures Technical Analysis – November 16, 2015 Forecast
By:
December E-mini NASDAQ-100 Index futures sold-off sharply shortly after the early session opening. The move put the index on the weak side of the main
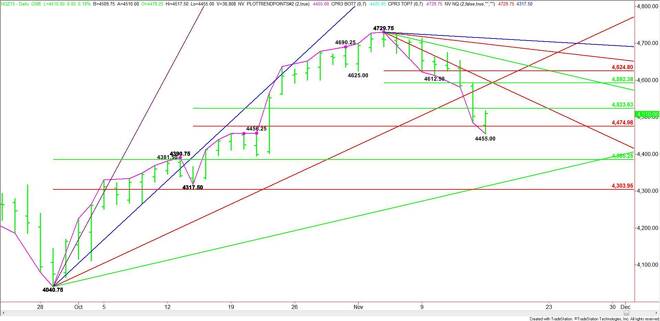
December E-mini NASDAQ-100 Index futures sold-off sharply shortly after the early session opening. The move put the index on the weak side of the main Fibonacci level, but buyers came in quickly to stop the price slide. This put the index up for the session, setting up a possible reversal bottom and putting the index in a position to challenge the main 50%.
The main trend is up according to the daily swing chart. However, momentum is clearly to the downside. The trend will change on a trade through 4317.50.
Today’s session begins with the index down eight days from the 4729.75 main top formed on November 4. This puts it in the window of time for a potentially bullish closing price reversal top.
There are three ranges in play today. The first is 4040.75 to 4729.75. Its retracement zone at 4385.25 to 4304.00 is the primary downside target.
The second range is 4317.50 to 4729.75. Its retracement zone is 4523.75 to 4475.00. Earlier in the session, the index crossed to the weak side of the Fib level at 4475.00 before quickly regaining it.
The third range is 4729.75 to 4455.00. Its retracement zone at 4592.50 to 4624.75 is the primary upside target.
The direction of the market today is likely to be determined by trader reaction to Friday’s close at 4502.00. A close over this number will form a potentially bullish closing price reversal bottom.
A sustained move over 4502.00 will indicate the presence of buyers. The first target is a 50% level at 4523.75. This level is a trigger point for an upside breakout. The first potential upside target is a resistance cluster at 4584.75, 4592.50 and 4601.75.
A sustained move under 4502.00 will signal the presence of sellers. The first target is a Fibonacci level at 4475.00. This is followed by today’s intra-day low at 4455.00. This level is also the trigger point for a steep downside breakout with potential targets 4385.25, 4312.75 and 4304.00.
Watch the price action and read the order flow at 4502.00 today. Trader reaction to this level will tell us whether the buyers or sellers are in control. Look for increased volatility and a possible two-sided trade because of heightened concerns of geopolitical risk.
About the Author
James Hyerczykauthor
James Hyerczyk is a U.S. based seasoned technical analyst and educator with over 40 years of experience in market analysis and trading, specializing in chart patterns and price movement. He is the author of two books on technical analysis and has a background in both futures and stock markets.


Advertisement