December E-mini NASDAQ-100 Index futures are trading steady shortly ahead of the regular session opening. On Monday, the index followed through to the
December E-mini NASDAQ-100 Index futures are trading steady shortly ahead of the regular session opening. On Monday, the index followed through to the upside, following the previous day’s closing price reversal bottom. However, the index ran into resistance inside a short-term retracement zone.
Today, we’ll be looking to see if enough buying comes in to take out the retracement zone to make 4455.00 a new swing bottom. Or, if the selling will be strong enough to stop the rally and set up a potentially bearish secondary lower top.
The main trend is up according to the daily swing chart.
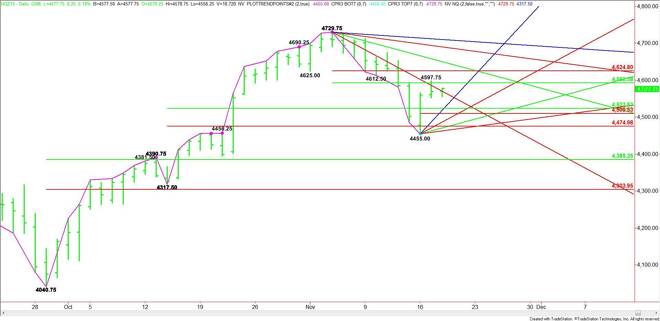
The intermediate range is 4317.50 to 4729.75. Its retracement zone at 4523.50 to 4475.00 provided support earlier in the week. This area is still support today.
The short-term range is 4729.75 to 4455.00. Its retracement zone is 4592.50 to 4624.75. This zone stopped the rally on Tuesday when the index reached 4597.75.
Based on yesterday’s close at 4569.50, the direction of the market today is likely to be determined by trader reaction to the steep downtrending angle at 4569.75.
A sustained move over 4569.75 will indicate the presence of buyers. The first upside target is the 50% level at 4592.50. This is followed closely by yesterday’s high at 4597.75.
A trade through 4597.75 could create enough upside momentum to trigger a quick rally into the Fibonacci level at 4624.75. The next target is a downtrending angle at 4649.75. Additional angles come in at 4689.75 and 4709.75. The latter is the last potential resistance before the 4729.75 main top.
A sustained move under 4569.75 will signal the presence of sellers. The daily chart indicates there is room to the downside with the next target a price cluster at 4523.50 to 4519.00.
Additional targets that fall inside the 4523.50 to 4475.00 retracement zone are 4509.50 and 4487.00.
Watch the price action and read the order flow at 4569.75. Trader reaction to this angle will tell us whether the bulls or the bears are in control today.
James Hyerczyk is a U.S. based seasoned technical analyst and educator with over 40 years of experience in market analysis and trading, specializing in chart patterns and price movement. He is the author of two books on technical analysis and has a background in both futures and stock markets.