
Advertisement
Advertisement
E-mini Russell 2000 Index (TF) Futures Technical Analysis – August 4, 2015 Forecast
By:
September E-mini Russell 2000 Index futures are trading sideways-to-lower during the pre-market session. The market is currently trading between a pair of
September E-mini Russell 2000 Index futures are trading sideways-to-lower during the pre-market session. The market is currently trading between a pair of retracement zones, suggesting investor indecision. They may be waiting for clarity regarding the Fed’s decision to raise interest rates. This is likely to occur, following the release of the U.S. Non-Farm Payrolls report on Friday. Until then, we may be looking at a choppy, two-sided trade. Volume may also be below average.
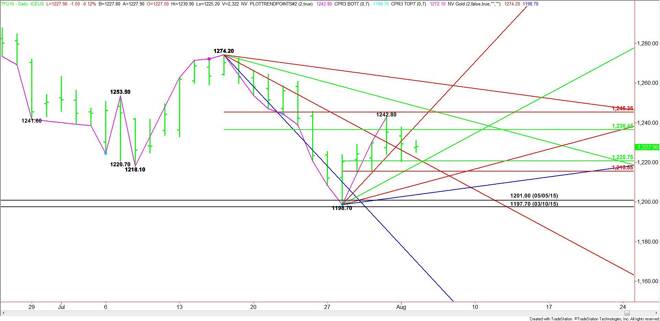
The main trend is down on the daily chart. The main range is 1274.20 to 1198.70. Its retracement zone is 1236.50 to 1245.40. This zone stopped the rally on July 31 at 1242.80 and on Monday at 1237.60.
The short-term range is 1198.70 to 1242.80. Its retracement zone is 1220.70 to 1215.50. This zone was tested yesterday.
Currently, the market is trading between a pair of 50% levels at 1236.50 to 1220.70. Since these levels represent balance points and the market is trading between them, it is further confirmation of investor indecision.
On the downside, the first targets are a price cluster at 1222.20, 1220.70 and 1218.70. Watch for a technical bounce on the first test of this area. If 1218.70 fails as support then look for a further break into the Fibonacci level at 1215.50. The daily chart opens up to the downside under this level with the next target an uptrending angle at 1208.70.
The first upside target is a 50% level at 1236.50. This is followed by an uptrending angle at 1238.70, a Fibonacci level at 1245.40 and a downtrending angle at 1248.20. Look for an acceleration to the upside if 1248.20 is taken out with conviction with the next target coming in at 1261.20.
Order flow will determine the direction of the market today. There is no other way to look at the market today. It could test 1220.75 or rally into 1236.50. Traders will be looking for clarity before they make decisions with conviction.
About the Author
James Hyerczykauthor
James Hyerczyk is a U.S. based seasoned technical analyst and educator with over 40 years of experience in market analysis and trading, specializing in chart patterns and price movement. He is the author of two books on technical analysis and has a background in both futures and stock markets.


Advertisement