
Advertisement
Advertisement
E-mini Russell 2000 Index (TF) Futures Technical Analysis – November 9, 2015 Forecast
By:
December E-mini Russell 2000 Index futures are trading flat-to-slightly lower during the pre-market session. On Friday, the index closed higher after
December E-mini Russell 2000 Index futures are trading flat-to-slightly lower during the pre-market session. On Friday, the index closed higher after recovering from early session weakness.
The index initially sold-off shortly after the release of the stronger-than-expected U.S. Non-Farm Payrolls report. The strength of the report caused traders to up the probability of a December Fed rate hike from 50% to 70%.
The initial sell-off represented those traders who believe that a rate hike will be bearish for stocks. The late session rally was likely buyers who believe the report signals the economy is strong enough to support higher stock prices.
This week, investors will get the opportunity to react to several Fed member speeches. All are expected to present hawkish commentary. The major report is Friday’s U.S. retail sales report. This is important because it will tell us whether the consumer is helping to strengthen the economy.
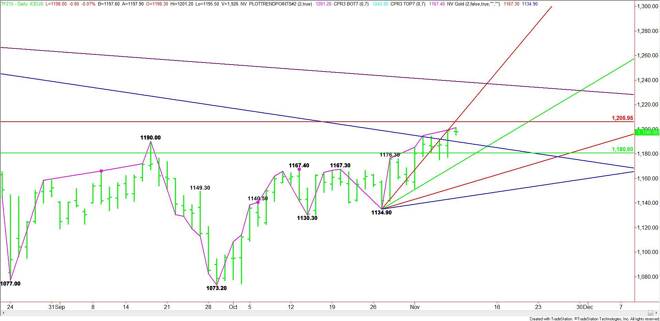
Technically, the main trend is up according to the daily swing chart. The contract range is 1288.00 to 1073.20. Its retracement zone is 1180.60 to 1206.00. The index has closed inside this zone for four consecutive days. On Friday, the index found support on the lower or 50% level at 1180.60.
Friday’s close at 1198.80 puts the index in a position to challenge the upper or Fibonacci level at 1206.00. Trader reaction to this level could set the tone for the week.
A sustained move over 1206.00 today could trigger a spike into a short-term uptrending angle at 1206.90. Crossing to the strong side of this angle and sustaining the move will put the index in a bullish position.
The next major upside target over 1206.90 is a long-term downtrending angle at 1239.00.
A failure to overcome 1206.00 will signal the presence of sellers. The first downside objective is a long-term downtrending angle at 1190.00. This is followed by the major 50% level at 1180.60.
A sustained move under 1180.60 will signal a serious shift in investor sentiment. A close under this level will indicate the selling is greater than the buying.
Based on Friday’s close at 1198.80, look for a bullish tone to develop on a sustained move over 1206.00. A bearish tone will develop on a sustained move under 1190.00.
About the Author
James Hyerczykauthor
James Hyerczyk is a U.S. based seasoned technical analyst and educator with over 40 years of experience in market analysis and trading, specializing in chart patterns and price movement. He is the author of two books on technical analysis and has a background in both futures and stock markets.


Advertisement