
Advertisement
Advertisement
E-mini Russell 2000 Index (TF) Futures Technical Analysis – October 16, 2014 Forecast
By:
The price action by the December-E-mini Russell 2000 Index is a little friendlier than the other indices. This could be a sign that the major indices are
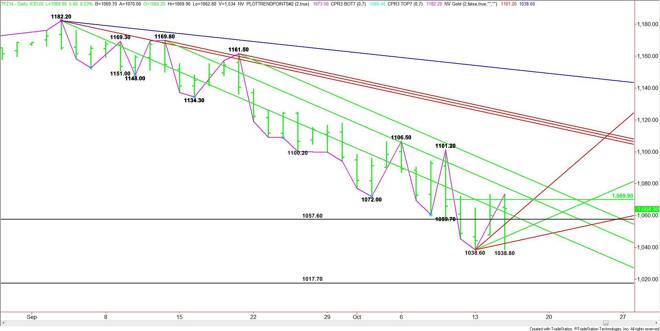
The first thing traders should’ve noticed is buyers came in at 1038.80 on Wednesday to defend the previous main bottom at 1038.60. The rebound from this level was so strong the index closed higher for the session. This may have been a sign that shorts were covering in anticipation of a bottom.
The close at 1064.30 was on the bullish side of a long-term downtrending angle at 1058.20 and an uptrending angle at 1062.60, giving the index a slight upside bias.
The short-term range is 1101.20 to 1038.60. Its pivot price at 1069.90 is controlling the short-term direction of the market. Overcoming this level could trigger a rally into the next downtrending angle at 1073.80. Overtaking this angle with conviction could drive the market into the next angle at 1085.50.
Look for a bullish tone today on a sustained move over 1069.90. The index could chop around all day if it trades between 1038.60 and 1069.90. A bearish tone could develop under 1038.60 with 1017.70 a potential downside target.
About the Author
James Hyerczykauthor
James Hyerczyk is a U.S. based seasoned technical analyst and educator with over 40 years of experience in market analysis and trading, specializing in chart patterns and price movement. He is the author of two books on technical analysis and has a background in both futures and stock markets.


Advertisement