
Advertisement
Advertisement
E-mini Russell 2000 Index (TF) Futures Technical Analysis – October 20, 2014 Forecast
By:
After leading the stock indices up from the bottom last week, the December E-mini Russell 2000 Index diverged from the indices to the downside at the
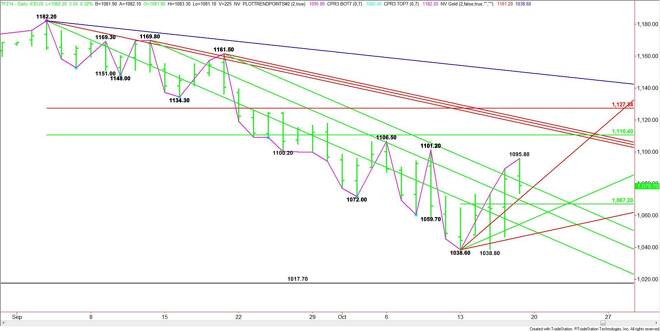
After leading the stock indices up from the bottom last week, the December E-mini Russell 2000 Index diverged from the indices to the downside at the close on Friday. The rally failed at 1095.80, just a little below the last main top at 1101.20. A move through this level would’ve turned the main trend to up on the daily chart.
The new short-term range is 1038.60 to 1095.80. The pivot price created by this range at 1067.20 is controlling the short-term direction of the market. Trader reaction to this angle will set the tone for the day.
The nearest uptrending Gann angle support is at 1078.60. Taking out this angle and the pivot should trigger a break into the next angle at 1058.60. This is followed by the last major angle before the 1038.60 main bottom. This angle is at 1048.60.
The upside targets are layered today at 1095.80, 1101.20 and 1106.50.
The main range is 1182.20 to 1038.60. Its retracement zone at 1110.40 to 1127.30 is the primary upside target. Three downtrending Gann angles pass through this zone at 1116.20, 1117.80 and 1119.50, making them valid targets only.
Holding above 1067.20 is likely to set a bullish tone today. A sustained move through it will be bearish.
About the Author
James Hyerczykauthor
James Hyerczyk is a U.S. based seasoned technical analyst and educator with over 40 years of experience in market analysis and trading, specializing in chart patterns and price movement. He is the author of two books on technical analysis and has a background in both futures and stock markets.


Advertisement