
Advertisement
Advertisement
E-mini Russell 2000 Index (TF) Futures Technical Analysis – October 23, 2014 Forecast
By:
The December E-mini Russell 2000 Index slammed into a series of downtrending angles inside a retracement zone on Wednesday, helping to form a potentially
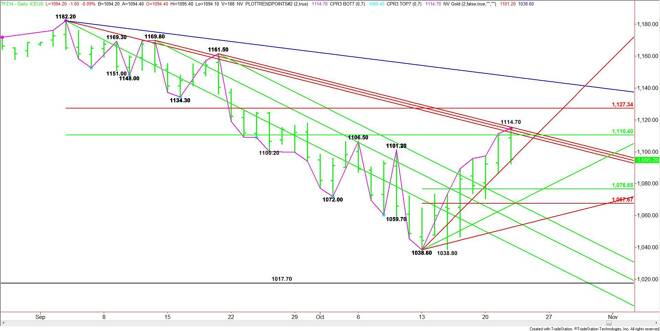
The December E-mini Russell 2000 Index slammed into a series of downtrending angles inside a retracement zone on Wednesday, helping to form a potentially bearish closing price reversal top. A trade through 1029.40 will confirm this chart pattern.
The short-term range is 1038.60 to 1114.70. The retracement zone formed by this range at 1076.60 to 1067.70 is the primary downside target.
The first uptrending angle to watch today is 1102.60. The close at 1095.20 puts the market on the weak side of this angle on the opening, but the selling is not likely to start until yesterday’s low at 1092.40 is taken out with better-than-average volume.
The daily chart indicates there is room to the downside with a 50% level at 1076.60 the first target, followed by an uptrending angle at 1070.60. The last downside target is the Fibonacci level at 1067.70.
A failure to take out 1092.40 and regaining the uptrending angle at 1102.60 will set a bullish tone. This could trigger a rally into the series of downtrending angles that stopped the rally yesterday at 1110.20, 1111.80 and 1113.50.
The tone of the market today will be determined by trader reaction to 1092.40.
About the Author
James Hyerczykauthor
James Hyerczyk is a U.S. based seasoned technical analyst and educator with over 40 years of experience in market analysis and trading, specializing in chart patterns and price movement. He is the author of two books on technical analysis and has a background in both futures and stock markets.


Advertisement