
Advertisement
Advertisement
E-mini Russell 2000 Index (TF) Futures Technical Analysis – October 30, 2014 Forecast
By:
December E-mini Russell 2000 Index futures rallied to 1153.70 on Wednesday before closing lower. This is a potentially bearish chart pattern, but it would
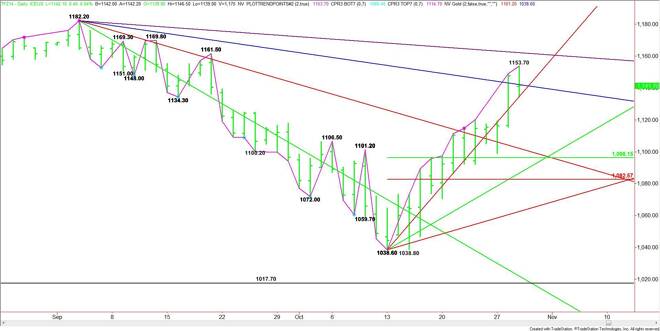
December E-mini Russell 2000 Index futures rallied to 1153.70 on Wednesday before closing lower. This is a potentially bearish chart pattern, but it would have been more clearly defined had the market closed below the opening. Nonetheless, it looks as if the pattern is enough to give the market a downside bias early today.
Supporting the notion for weakness is the Fed’s slightly hawkish monetary policy from Wednesday. Small cap companies don’t like rising interest rates because their cost of borrowing goes up. So if the market believes the Fed then the Russell should start to feel the pressure before the other indices.
We should know early in the session where the bias is because yesterday’s close at 1141.70 has put the index on the bearish side of the steep uptrending angle that had been guiding it higher since the October 13 bottom at 1038.60. This angle, moving up 8 points per day, comes in at 1142.60 today.
A downtrending angle from the 1182.20 top is at 1141.20. Breaking under this angle will also be a sign of weakness while taking out yesterday’s low at 1134.30 with conviction will signal increased selling pressure. This could be profit-taking or fresh shorting.
The daily chart opens up to the downside under 1141.20. You can see from the chart a lot of space to the downside before the first target at 1096.20. This price is followed by another uptrending angle at 1090.60.
On the upside, overcoming and holding above 1142.60 will be a sign that buyers are coming back in. The first upside target is yesterday’s high at 1153.70, followed by a downtrending angle at 1161.70.
This last angle at 1161.70 forms a resistance cluster with the September 19 top at 1161.50, making it significant. The market expands over 1161.70 to the next two tops at 1169.80 and 1182.20.
Look for a bearish tone under 1141.20 and a bullish tone over 1142.60. It could be “chop city” in between these two points while traders try to figure out which way they want the market to go.
About the Author
James Hyerczykauthor
James Hyerczyk is a U.S. based seasoned technical analyst and educator with over 40 years of experience in market analysis and trading, specializing in chart patterns and price movement. He is the author of two books on technical analysis and has a background in both futures and stock markets.


Advertisement