
Advertisement
Advertisement
E-mini Russell 2000 Index (TF) Futures Technical Analysis – October 6, 2014 Forecast
By:
December E-mini Russell 2000 Index futures followed through to the upside on Friday, confirming the previous day’s potentially bullish closing price
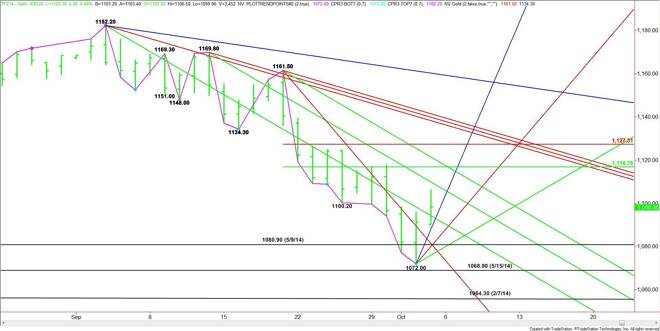
December E-mini Russell 2000 Index futures followed through to the upside on Friday, confirming the previous day’s potentially bullish closing price reversal bottom. The upside action makes 1072.00 a new minor bottom.
The main trend is down on the daily chart, however, the closing price reversal chart pattern often leads to a 50% to 61.8% retracement of the last break. The last break was 1161.50 to 1072.00 so the major upside target is 1116.80 to 1127.30.
The first target today is a downtrending angle at 1105.80. The next angle at 1117.50 passes through the retracement zone, making it a valid upside target.
On the downside, steep uptrending support comes in at 1104.00. This is followed by additional uptrending angles at 1088.00 and 1080.00.
Since the main trend is down on the daily chart, look for sellers to come in on the first tests of the retracement zone. The best area to watch for selling pressure is 1116.75 to 1117.50.
The retracement zone is a key area to watch this week because the index will either stop inside it to form another potentially bearish secondary lower top or extend upward to test the major highs ranging from 1161.50 to 1182.20. Watch the order flow and price action in this area to determine whether buyers or sellers have the upper hand.
About the Author
James Hyerczykauthor
James Hyerczyk is a U.S. based seasoned technical analyst and educator with over 40 years of experience in market analysis and trading, specializing in chart patterns and price movement. He is the author of two books on technical analysis and has a background in both futures and stock markets.


Advertisement