
Advertisement
Advertisement
E-mini Russell 2000 Index (TF) Futures Technical Analysis – October 7, 2014 Forecast
By:
The December E-mini Russell 2000 Index’s failure to follow-through to the upside on Monday, encouraged sellers to press the market into the close. The
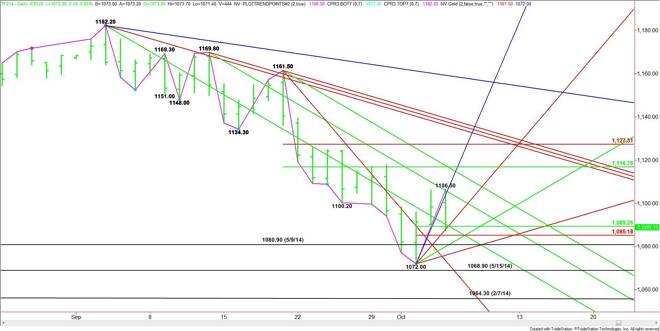
The December E-mini Russell 2000 Index’s failure to follow-through to the upside on Monday, encouraged sellers to press the market into the close. The weakness came as a surprise because the index was set up for a retracement into at least the 50% level at 1116.75. The inability to reach this level while the other major indices were completing their retracements is another sign that the Russell is the weakest index.
The resistance angle which stopped the rally on Monday drops in at 1101.80 today. A breakout over this angle could trigger a rally into the next angle at 1113.50.
On the downside, the market found support on a steep uptrending angle. This angle moves up to 1096.00 today. Yesterday’s close at 1089.10 was below this angle, giving the market a downside bias from the opening.
The short-term range is 1072.00 to 1106.50. The retracement zone created by this range at 1089.20 to 1085.20 was tested yesterday. This is the key area to watch today. Bullish traders will try to form a secondary higher bottom while bearish traders will try to drive the market through this level to set up a test of the main bottom at 1072.00.
If 1085.20 fails then look for a drive into the next two uptrending angles at 1084.00 and 1078.00. These are the last lines of defense before 1072.00.
A failure at 1072.00 should trigger a break into the May 15 bottom at 1068.90. The market could accelerate to the downside if this level is taken out with conviction since the next major bottom is the low of the year at 1064.30.
Look for the index to straddle 1089.20 to 1085.20 early. Trader reaction to this zone will set the tone for the day. Holding 1089.20 will set a bullish tone while a break through 1085.20 will be bearish.
About the Author
James Hyerczykauthor
James Hyerczyk is a U.S. based seasoned technical analyst and educator with over 40 years of experience in market analysis and trading, specializing in chart patterns and price movement. He is the author of two books on technical analysis and has a background in both futures and stock markets.


Advertisement