
Advertisement
Advertisement
E-mini S&P 500: Another Week, Another Reversal Top
Updated: Aug 20, 2015, 23:00 GMT+00:00
For the second time in a week, the December E-mini S&P 500 formed a potentially bearish closing price reversal top on the daily chart. The chart
For the second time in a week, the December E-mini S&P 500 formed a potentially bearish closing price reversal top on the daily chart. The chart pattern was triggered by worries over the U.S.“fiscal cliff”. It seems as if investors may be feeling the need to pare positions, a move that could trigger a substantial decline over the near-term.
Although the rally from the November 16 bottom at 1340.25 to the December 3 top at 1424.00 has been impressive, the main trend on the daily chart remains down since no major swing charts have been crossed. At this time, the chart pattern fits the classic definition of a downtrend – lower tops and lower bottoms.
Trend trading theory suggests that a breakout through the last main top from November 7 at 1431.75 will turn the trend higher. This does not mean the market will accelerate to the upside from there and may actually hesitate and pullback before doing so. At this time, the conditions are ripe for a similar move also since a closing price reversal top often indicates the start of a 2 to 3 day break equal to at least 50% of the last rally.
Closing price reversal tops are most likely to form following major retracements. In addition, the best typically occur following prolonged moves of 7 to 10 days. Based on the top at 1468.00 to the bottom at 1340.25, a major retracement zone was established at 1404.25 to 1419.25. Although upside momentum triggered a move through the upper boundary to 1424.00, the failure to follow-through to the upside and the subsequent close back inside of the retracement zone casts a negative pall on the market.
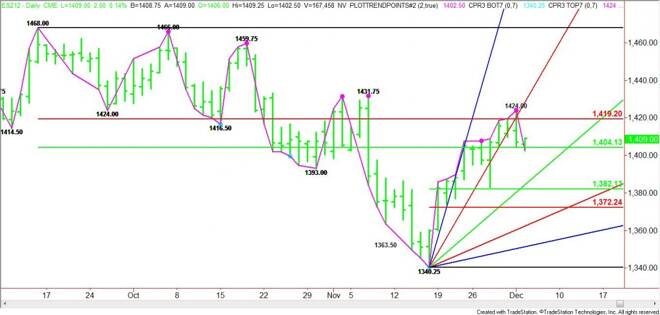
Daily December E-mini S&P 500 Pattern, Price & Time Analysis
The current rally from 1340.25 to 1424.00 has created a retracement zone at 1382.25 to 1372.25. This area is the potential downside target. Since the chart pattern typically triggers a 2 to 3 day break, it is possible that the December E-mini S&P 500 is setting up for a near-term break of at least 41.75 points.
Over the past two weeks, the futures contract has followed a steep Gann angle higher. This angle, moving at a rate of 8 points per day since November 16, acted as a guide and controlled the short-term direction of the market. On Monday, the index broke the angle with conviction and closed below it. This move may be giving bearish traders the clarity they need to continue to push the market lower. Today, the angle moves up to 1428.25, well above current prices. Normal rotation of prices suggests that the next angle at 1384.25 is the next potential downside target today.
In summary, overnight the daily December E-mini S&P 500 followed through to the downside to confirm the closing price reversal top. Although the market may “ping-pong” between the 50% price level at 1404.25 and the 61.8% percent level at 1419.25 over the near-term, the potentially bearish pattern will remain intact as long as the top at 1424.00 is not violated.
In the best case scenario, the market will form a solid top and allow for ample distribution before heavy selling pressure creates a cascading break. Since this market is being news driven, traders should look for increased volatility in both directions. If the reversal top fails then investors should look to reverse direction in anticipation of a huge acceleration to the upside.
About the Author
FX Empire editorial team consists of professional analysts with a combined experience of over 45 years in the financial markets, spanning various fields including the equity, forex, commodities, futures and cryptocurrencies markets.


Advertisement