
Advertisement
Advertisement
E-mini S&P 500 Index (ES) Futures Technical Analysis – August 10, 2015 Forecast
By:
September E-mini S&P 500 Index futures closed lower on Friday and for the week. The price action suggests investor indecision. Investors are looking
September E-mini S&P 500 Index futures closed lower on Friday and for the week. The price action suggests investor indecision. Investors are looking for guidance as to the timing of the first Fed interest rate hike since 2006. Since the Fed decision is data dependent, the index may be more sensitive to economic reports until the next Fed meeting in mid-September.
WEEKLY
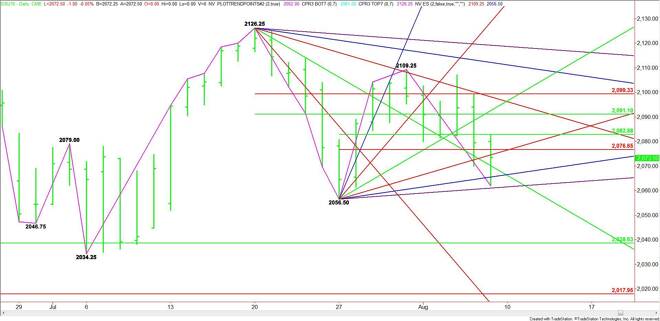
The main trend is up on the weekly swing chart. The short-term range is 2034.25 to 2126.25. Its retracement zone is 2080.25 to 2069.25. The index has straddled this zone for two weeks, indicating trader indecision. The index isn’t going to go anywhere until traders either commit to the long side on a sustained move over 2080.25, or to the downside on a sustained move under 2069.25.
On the upside, overtaking the steep angle at 2114.25 will put the index in a strong position. On the downside, a break could be labored because of a series of potential support levels at 2074.25, 2054.25, 2044.25 and 2038.50. A trade through 2034.25 will turn the main trend to down on the weekly chart.
DAILY
The main trend is up on the daily chart, but momentum is to the downside. The secondary lower top at 2109.25 suggests that sellers are in control with enough momentum to go after the swing bottom at 2056.50. A trade through this price will turn the main trend to down.
The daily chart indicates the possibility of an acceleration to the downside on a trade through 2056.50 since the next major target is the 50% level at 2038.50.
Based on the close at 2073.50, the first two downside targets are uptrending angles at 2066.50 and 2061.50. These are followed by the 2056.50 main bottom.
The first target on the upside is price cluster at 2076.50 to 2076.75. This area is followed by a 50% level at 2083.00. The market could make a big jump on a sustained move over 2083.00 with 2091.00 the next likely target.
The current price action suggests that the direction of the market today will likely be determined by trader reaction to the Fib level at 2076.75.
About the Author
James Hyerczykauthor
James Hyerczyk is a U.S. based seasoned technical analyst and educator with over 40 years of experience in market analysis and trading, specializing in chart patterns and price movement. He is the author of two books on technical analysis and has a background in both futures and stock markets.


Advertisement