
Advertisement
Advertisement
E-mini S&P 500 Index (ES) Futures Technical Analysis – August 25, 2015 Forecast
By:
September E-mini S&P 500 Index futures are called sharply higher based on the pre-market trade. Buyers came in early in the session after the index
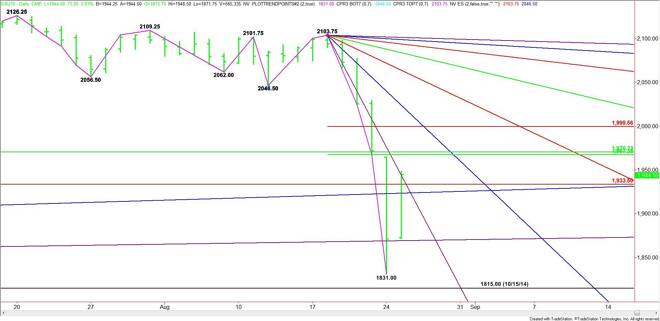
September E-mini S&P 500 Index futures are called sharply higher based on the pre-market trade. Buyers came in early in the session after the index gapped higher on the opening. Value-seeking investors came in on Monday at 1831.00 in defense of the October 15, 2014 main bottom at 1815.00.
Currently, the index is straddling a major Fibonacci level at 1934.00. Trader reaction to this price is likely to determine the direction of the market the rest of the session.
A sustained move over 1934.00 should lead to a test of a steep downtrending angle at 1943.75. The new short-term range is 2103.75 to 1831.00. Its 50% level at 1967.50 is the next upside target, followed closely by a major 50% level at 1970.75.
The daily chart opens up substantially to the upside over 1970.75. The next target is the short-term Fibonacci level at 1999.50. This is followed closely by a downtrending angle at 2023.75.
The key area on the upside is the 50% cluster at 1967.50 to 1970.75. The market may straddle this area today before traders make their move into the close.
If buyers fail to take out the major Fibonacci level at 1934.00 with conviction then this will signal the presence of sellers. The first downside target is a long-term uptrending angle at 1923.25. This angle is a potential trigger point for a steep break back to 1869.00. This is the last major angle before yesterday’s low at 1831.00 and the October 15 main bottom at 1815.00.
If yesterday’s low at 1831.00 to today’s pre-market high at 1948.50 forms a range then its 50% level or pivot at 1889.75 also becomes a potential downside target.
Watch the price action and read the order flow at 1934.00 during the regular session. This will tell us whether the bulls or the bears are in control.
About the Author
James Hyerczykauthor
James Hyerczyk is a U.S. based seasoned technical analyst and educator with over 40 years of experience in market analysis and trading, specializing in chart patterns and price movement. He is the author of two books on technical analysis and has a background in both futures and stock markets.


Advertisement