There could be some volatility on the opening of the September E-mini S&P 500 Index futures contract during the pre-market session. This would be in
There could be some volatility on the opening of the September E-mini S&P 500 Index futures contract during the pre-market session. This would be in reaction to the hawkish comments from Fed Vice Chair Stanley Fischer on Saturday. Fischer said that despite the recent financial market volatility, the central bank remains on track for an interest rate hike in 2015. He cited the trending labor market and inflation as the key reasons why the Fed would raise rates.
Fischer’s comments and Friday’s U.S. Non-Farm Payrolls report could lead to a sideways trade for most of the week as many of the major players may take to the sidelines ahead of the jobs report. Manufacturing PMI data out of China on Tuesday could create renewed volatility.
The index made a strong recovery from last week’s low, but if you look at the price action for the month, all it did was retrace 50% to 61.8% of the break from the August 18 top to the August 24 bottom.
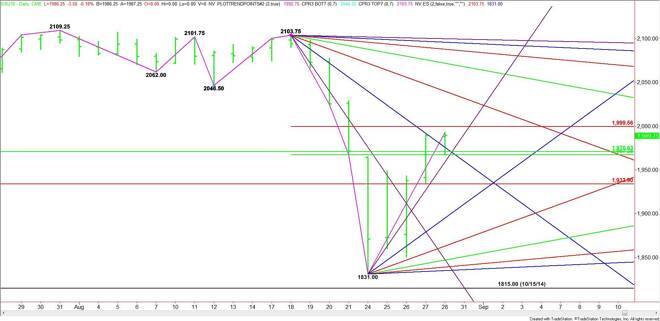
The main trend is down. The main range is 2103.75 to 1831.00. Its retracement zone is 1967.50 to 1999.50. A major 50% level also comes in at 1970.50. Trader reaction to this retracement zone is likely to set the tone for the day and perhaps the week.
A sustained move over the Fibonacci level at 1999.50 will signal the presence of buyers. The daily chart indicates there is room to the upside with the next target a downtrending angle at 2031.75. This is followed by another downtrending angle at 2067.75.
A failure to hold the 50% level at 1967.25 will signal the presence of sellers. A sustained move under the downtrending angle at 1959.75 will signal that the selling is getting stronger. The next downside target is a Fibonacci level at 1934.00 and an uptrending angle at 1911.00.
Volume may be down this week so be careful buying strength and selling weakness. Look for a rally on a sustained move over 1999.50. Weakness is likely to develop under 1967.25.
Try not to get chopped up if the index gets caught between 1967.25 and 1999.50.
James Hyerczyk is a U.S. based seasoned technical analyst and educator with over 40 years of experience in market analysis and trading, specializing in chart patterns and price movement. He is the author of two books on technical analysis and has a background in both futures and stock markets.