
Advertisement
Advertisement
E-mini S&P 500 Index (ES) Futures Technical Analysis – August 5, 2015 Forecast
By:
September E-mini S&P 500 Index futures posted an inside move, lower-close on Tuesday. The inside move indicates impending volatility. Volume was below
September E-mini S&P 500 Index futures posted an inside move, lower-close on Tuesday. The inside move indicates impending volatility. Volume was below average as many traders have taken to the sidelines ahead of Friday’s important U.S. Non-Farm Payrolls report. The longer the market trades sideways, the bigger the move once it breaks out. The chart pattern also suggests investors are waiting for clarity before coming in with conviction.
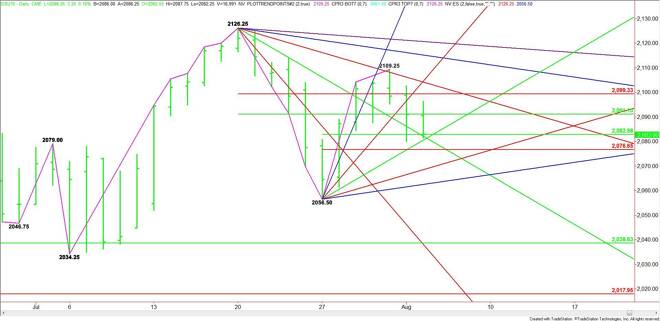
The main trend is up according to the daily swing chart. However, momentum seems to be shifting to the downside with the appearance of a possible secondary lower top at 2109.25.
The main range is 2126.25 to 2056.50. Its retracement zone is 2091.00 to 2099.50. The market has straddled the lower or 50% level at 2091.00 the last five days. This proves its importance as a pivot.
The short-term range is 2056.50 to 2109.25. Its retracement zone is 2082.75 to 2076.50. The upper or 50% level of this range has been tested the last two days.
On Tuesday, the index ping ponged between the two 50% levels at 2091.00 and 2082.75. These two prices appear to be controlling the short-term direction of the market. Because of the report on Friday, traders may try to hold the market inside this range.
An uptrending angle comes in at 2084.50 today. This forms a loose support cluster with the 50% level at 2082.75. There could be a technical bounce on a test of this zone, but it is also a trigger point for an acceleration to the downside with the next target a Fibonacci level at 2076.50. Further selling pressure could drive the market into another uptrending angle at 2070.50. The last angle before the 2056.50 main bottom is 2063.50.
A sustained move over the 50% level at 2091.00 will signal the presence of buyers. This move could create enough upside momentum to challenge the Fibonacci level at 2099.50. This is followed by a downtrending angle at 2102.25. This angle stopped the rally last week at 2109.25.
Besides being resistance, the angle at 2102.25 is also a potential trigger point for a surge into the next downtrending angle at 2114.25. The last angle before the 2126.25 top drops in at 2120.25.
Because of the low volume and volatility, be careful selling weakness and buying strength. If you want to reduce your trading to two points today then look for an upside bias on a sustained move over 2091.00 and a downside bias on a sustained move under 2082.75.
About the Author
James Hyerczykauthor
James Hyerczyk is a U.S. based seasoned technical analyst and educator with over 40 years of experience in market analysis and trading, specializing in chart patterns and price movement. He is the author of two books on technical analysis and has a background in both futures and stock markets.


Advertisement