September E-mini S&P 500 Index futures are trading flat shortly before the cash market opening. The market continues to consolidate between a pair of
September E-mini S&P 500 Index futures are trading flat shortly before the cash market opening. The market continues to consolidate between a pair of retracement zones and inside a triangle chart pattern as investors await tomorrow’s U.S. Non-Farm Payrolls report. This indicates impending volatility so you should be prepared for a breakout move.
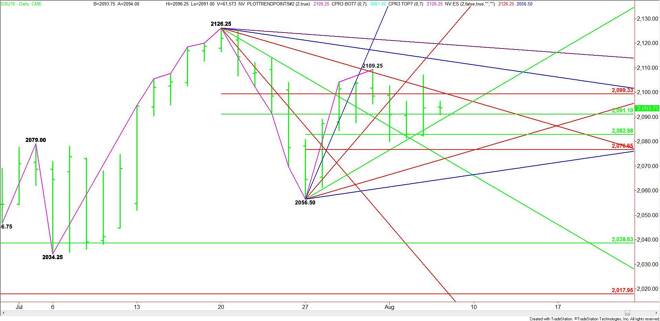
The main trend is up according to the daily swing chart. The main range is 2126.25 to 2056.50. Its retracement zone is 2091.00 to 2099.50. The market has straddled this zone for several days. Trader reaction to this zone should determine the direction of the market today and over the near-term.
The most important price is the 50% level at 2091.00. A sustained move over this level targets a Fibonacci level at 2099.50 and a downtrending angle at 2100.25. The angle is a potential trigger point for an acceleration to the upside with the next target a downtrending angle at 2113.75. The next angle over this is at 2119.75. This is the last major angle before the 2126.25 main top.
Crossing to the weak side of the 50% level at 2091.00 will signal the presence of sellers. The first target under this level is an uptrending angle at 2088.50. The daily chart opens up to the downside under this angle with the next target a short-term 50% level at 2082.75. This is followed by a Fibonacci level at 2076.50.
Taking out 2076.50 targets an uptrending angle at 2072.50. The last angle before the 2056.60 bottom comes in at 2064.50.
Based on the current price at 2093.75, the direction of the market today will be determined by trader reaction to 2091.00. Watch and read the price action and order flow at this price. This will tell us whether the bulls or the bears are in control.
James Hyerczyk is a U.S. based seasoned technical analyst and educator with over 40 years of experience in market analysis and trading, specializing in chart patterns and price movement. He is the author of two books on technical analysis and has a background in both futures and stock markets.