
Advertisement
Advertisement
E-mini S&P 500 Index (ES) Futures Technical Analysis – October 22, 2014, Forecast
By:
On Tuesday, the December E-mini S&P 500 Index surged to the upside after taking out four short-term retracement levels. The rally stalled when the
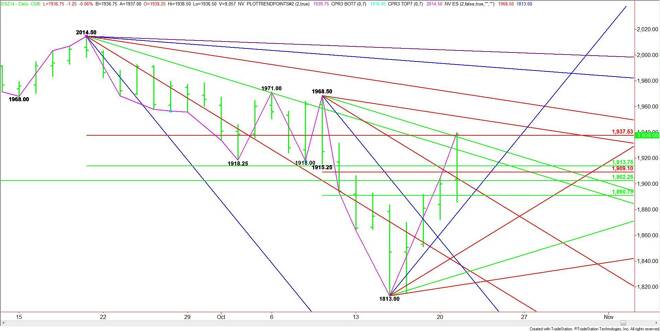
On Tuesday, the December E-mini S&P 500 Index surged to the upside after taking out four short-term retracement levels. The rally stalled when the index reached a combination downtrending angle and major Fibonacci level.
The downtrending angle to watch early in the session is 1932.50. The key Fibonacci level to keep an eye on is 1937.50. Taking out the Fib level could trigger another rally into the next downtrending angle at 1950.50. The market opens up over this angle with the best target the main top at 1968.50 and a downtrending angle from the top at the same price. Taking out this price will turn the main trend to up on the daily chart.
A failure to sustain a rally over 1937.50 will be the first sign of weakness. A break under 1922.50 will be the next. This could trigger a further break into a 50% level at 1913.75. Other potential support levels are layered at 1909.00, 1092.25 and 1890.75.
The tone of the market today will be determined by trader reaction to 1937.50.
About the Author
James Hyerczykauthor
James Hyerczyk is a U.S. based seasoned technical analyst and educator with over 40 years of experience in market analysis and trading, specializing in chart patterns and price movement. He is the author of two books on technical analysis and has a background in both futures and stock markets.


Advertisement