
Advertisement
Advertisement
E-mini S&P 500 Index (ES) Futures Technical Analysis – October 7, 2014, Forecast
By:
December E-mini S&P 500 Index futures closed lower after testing a key retracement zone and downtrending angle on Monday. Since the main trend is down
December E-mini S&P 500 Index futures closed lower after testing a key retracement zone and downtrending angle on Monday. Since the main trend is down on the daily chart, this wasn’t a surprise since new shorts usually refresh in these zones. In addition, countertrend traders often take profits in the same area.
What will be determined by the end of this week is whether Monday’s high is the start of a secondary lower top, or will it serve as a launching pad for another surge to the upside. A secondary lower top will be a sign of selling pressure and send a signal that sentiment may be turning to the downside.
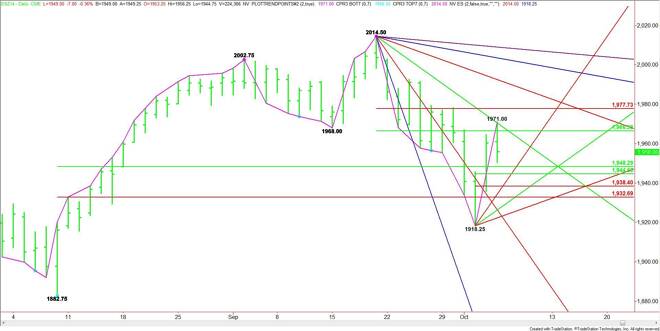
The major range is 1882.75 to 2014.50. The major retracement zone is 1948.25 to 1932.50.
The next range is 2014.50 to 1918.25. Its retracement zone is 1966.50 to 1977.75. This zone stopped the rally when the index reached 1971.00. A downtrending angle also comes in at 1966.50.
The new short-term range is 1918.25 to 1971.00. This makes 1944.50 to 1938.25 the next likely downside target. Uptrending Gann angles come in at 1942.25, 1930.25 and 1924.25.
The best support target is the 1938.25. This is a combination uptrending angle and Fibonacci level.
Look for a bullish tone if 1966.50 is taken out with conviction and a bearish tone under 1938.25.
About the Author
James Hyerczykauthor
James Hyerczyk is a U.S. based seasoned technical analyst and educator with over 40 years of experience in market analysis and trading, specializing in chart patterns and price movement. He is the author of two books on technical analysis and has a background in both futures and stock markets.


Advertisement