
Advertisement
Advertisement
E-mini S&P 500 Index (ES) Futures Technical Analysis – Straddling Uptrending Gann Angle
By:
Based on the current trade, the direction of the index the rest of the session is likely to be determined by trader reaction to the uptrending Gann angle at 2721.00.
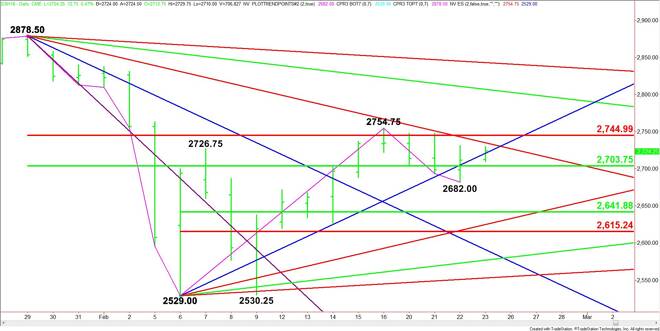
March E-mini S&P 500 Index futures are trading higher on Friday, but still on track to post a weekly loss as investors digest the release of the Federal Reserve’s monetary policy report.
At 1920 GMT, the benchmark index is trading 2725.00, up 13.50 or +0.50%.
The Fed’s monetary policy report said the central bank sees the U.S. economy past full employment, albeit with only “moderate” wage gains.
Daily Technical Analysis
The main trend is down according to the daily swing chart. A trade through 2682.00 will indicate the selling is getting stronger. A move through 2754.75 will change the main trend to up.
The main range is 2878.50 to 2529.00. The market is currently straddling its retracement zone at 2703.75 to 2745.00. This zone is controlling the near-term direction of the market.
The short-term range is 2529.00 to 2754.75. If the selling pressure continues then its retracement zone at 2641.75 to 2615.25 will become the primary downside target.
Daily Technical Forecast
Based on the current trade, the direction of the index the rest of the session is likely to be determined by trader reaction to the uptrending Gann angle at 2721.00.
A sustained move under over 2721.00 will indicate the presence of buyers. This could trigger a move into the steep downtrending Gann angle at 2734.50. This is followed by the main Fibonacci level at 2745.00 and the main top at 2754.75.
The main top at 2754.75 is the trigger point for an acceleration to the upside with the next target angle coming in at 2806.50.
A sustained move under 2721.00 will signal the presence of sellers. This could trigger a move into the main 50% level at 2703.75. Crossing to the weak side of this level could drive the market into this week’s low at 2682.00. This price is a trigger point for an extended break into 2641.75.
About the Author
James Hyerczykauthor
James Hyerczyk is a U.S. based seasoned technical analyst and educator with over 40 years of experience in market analysis and trading, specializing in chart patterns and price movement. He is the author of two books on technical analysis and has a background in both futures and stock markets.


Advertisement