


Ethereum (ETH) has booked a 10% gain in the past 7 days after bouncing off the $1,550 level early signs of a rejection of a key resistance could set the stage for the continuation of its downtrend.
In the past 24 hours, the token has retreated by nearly 2% after hitting the $1,800 mark. This has been a key area of support initially, but recently acted as resistance after a bearish breakout in the first few days of June.
Increased selling pressure at this level could indicate that bulls don’t have the necessary ammunition to push the price higher and could effectively create a bearish double-top pattern.
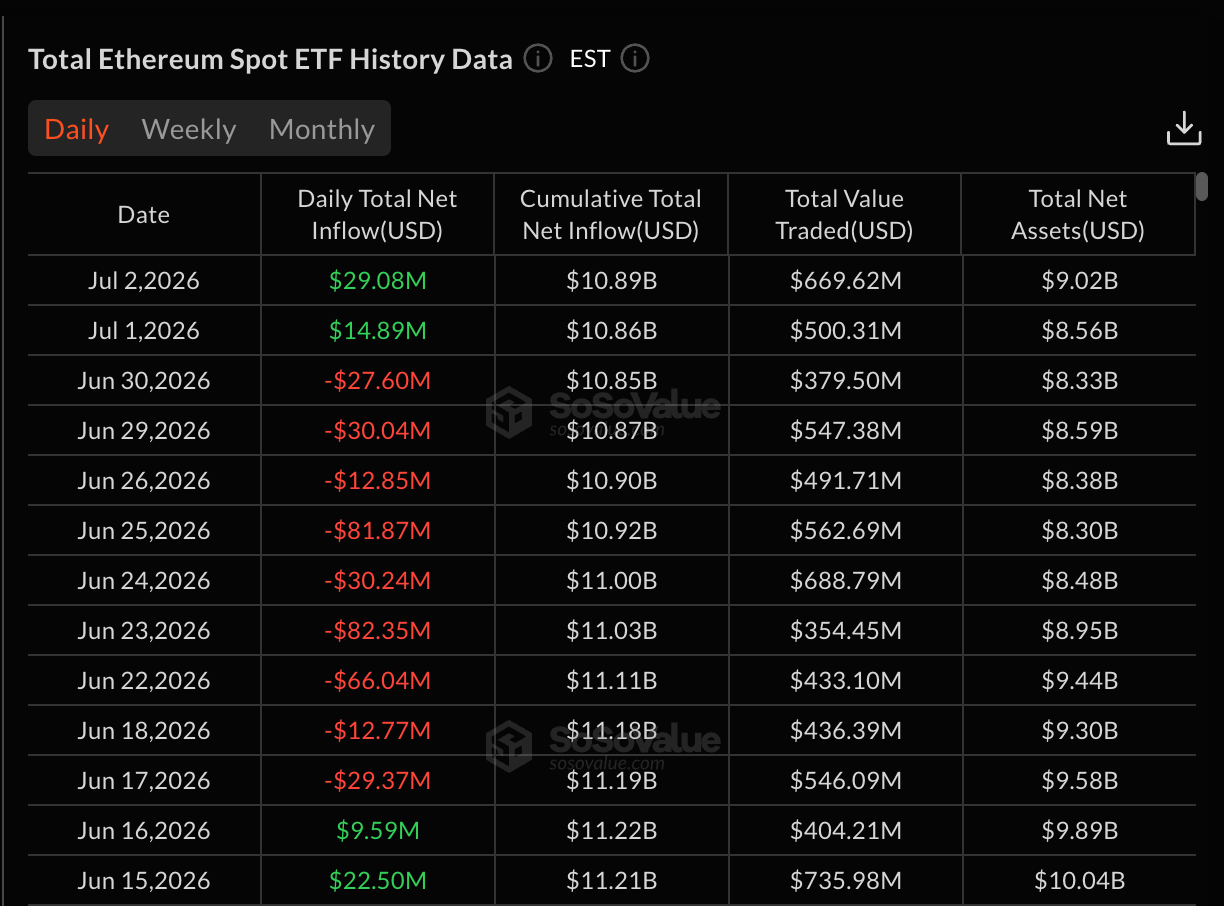
Net inflows to exchange-traded funds (ETFs) recovered last week after snapping a 9-day streak of outflows. In the past couple of days, these vehicles received around $44 million from investors.
Nonetheless, data from SoSoValue shows that, in the past 2 months, market participants have withdrawn more than $1 billion out of these funds, confirming that the market’s tone continues to be bearish.
Even though the Fear and Greed Index has recovered from a recent low of 15 (Extreme Fear) to 25 (Fear), the crypto market does not seem to be out of the woods yet as indicated by ETF inflows and this latest price action.
ETH Bounces Off Multi-Year Support But Breaks Long-Dated Buy Signal
In Ethereum’s case, our weekly buy signal was invalidated as the price dropped below its previous low.
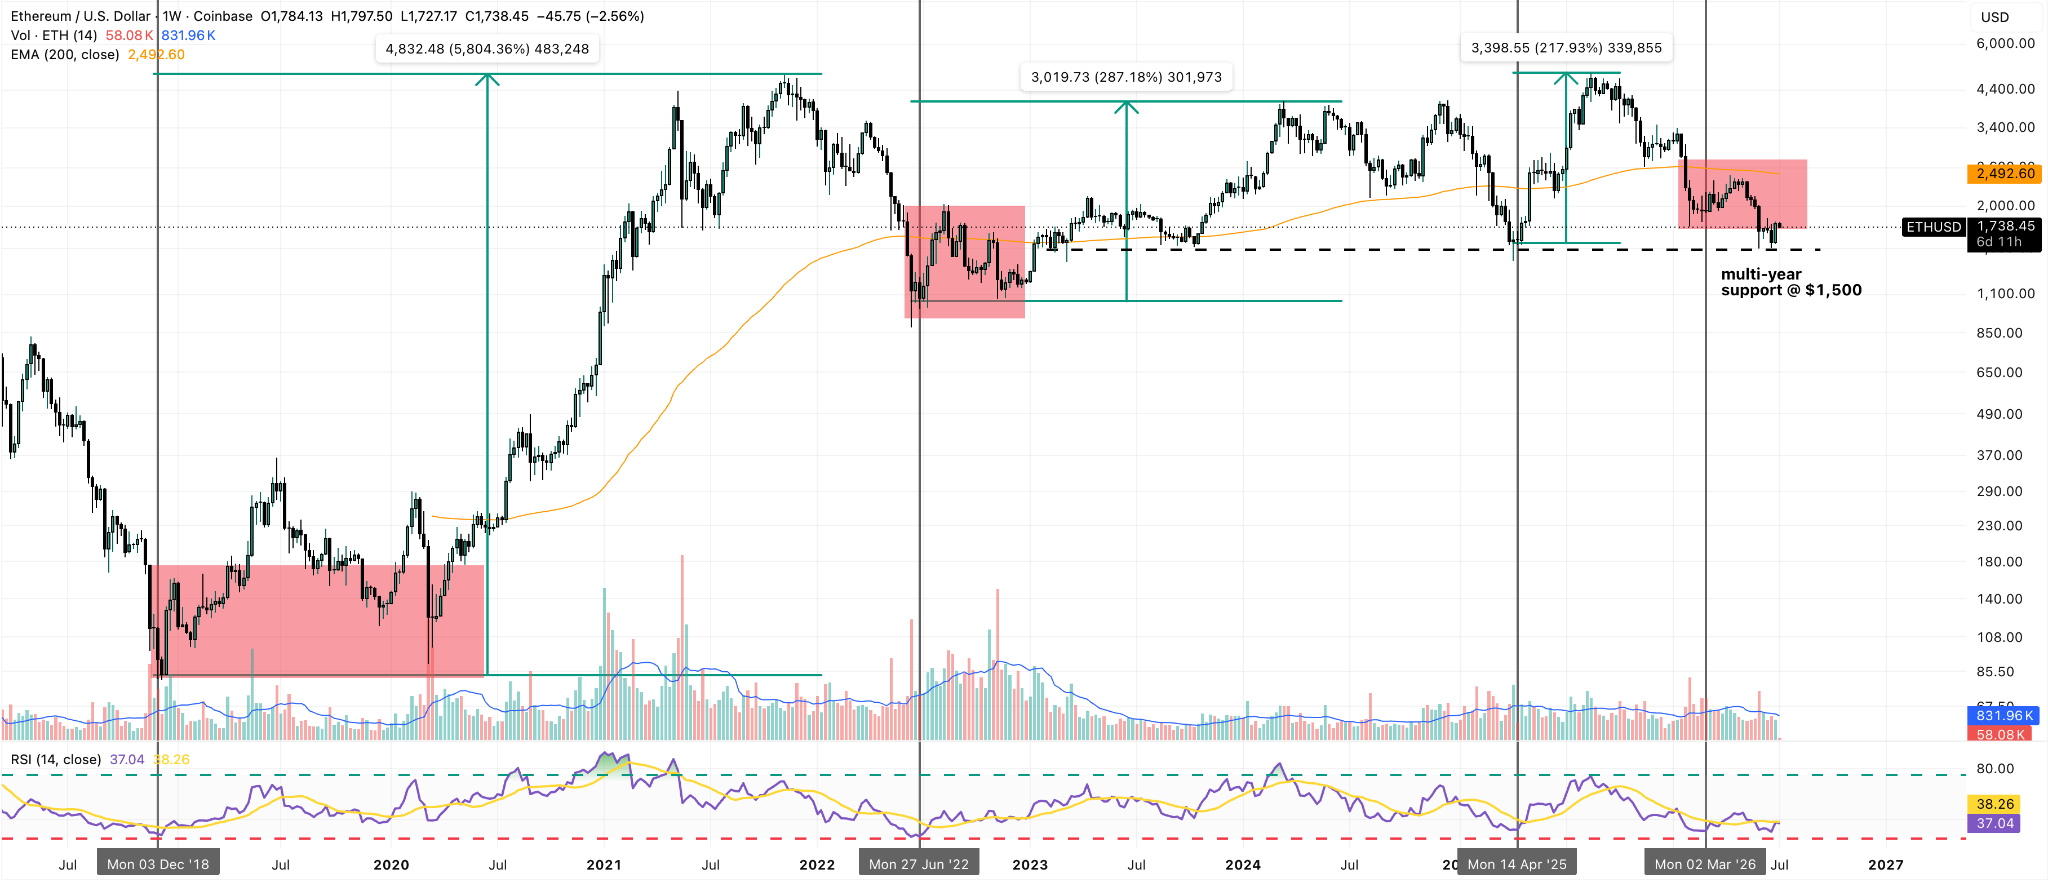
This signal marked the end of previous bearish cycles three times in a row whenever the weekly Relative Strength Index (RSI) dropped below 3. A new low after that signal had not happened in 8 years, and reflects the strength and persistence of this bear market.
However, the price just hit a multi-year support at $1,500 that could cushion Ethereum’s drop if this demand zone continues to be strong.
If we lose this key level, we could see a strong drop to $1,400 in the near term. However, as we have stated in previous ETH price predictions, we believe that we are either near or at the token’s cycle bottom.
If the weekly RSI rises past the signal line, that could be an early indication that the trend is reversing and ETH could start its recovery toward $1,800 and $2,400 at least.
Ethereum Price Forecast
Every new Ethereum analysis as it publishes, today's technical signal and key levels, live price — on one page.
See all Ethereum forecastsETH Still Has a Chance to Rise to $2,400 If This Happens
Heading to the daily chart, we can see that the price just rejected the $1,800 level with a relatively strong bearish candle.
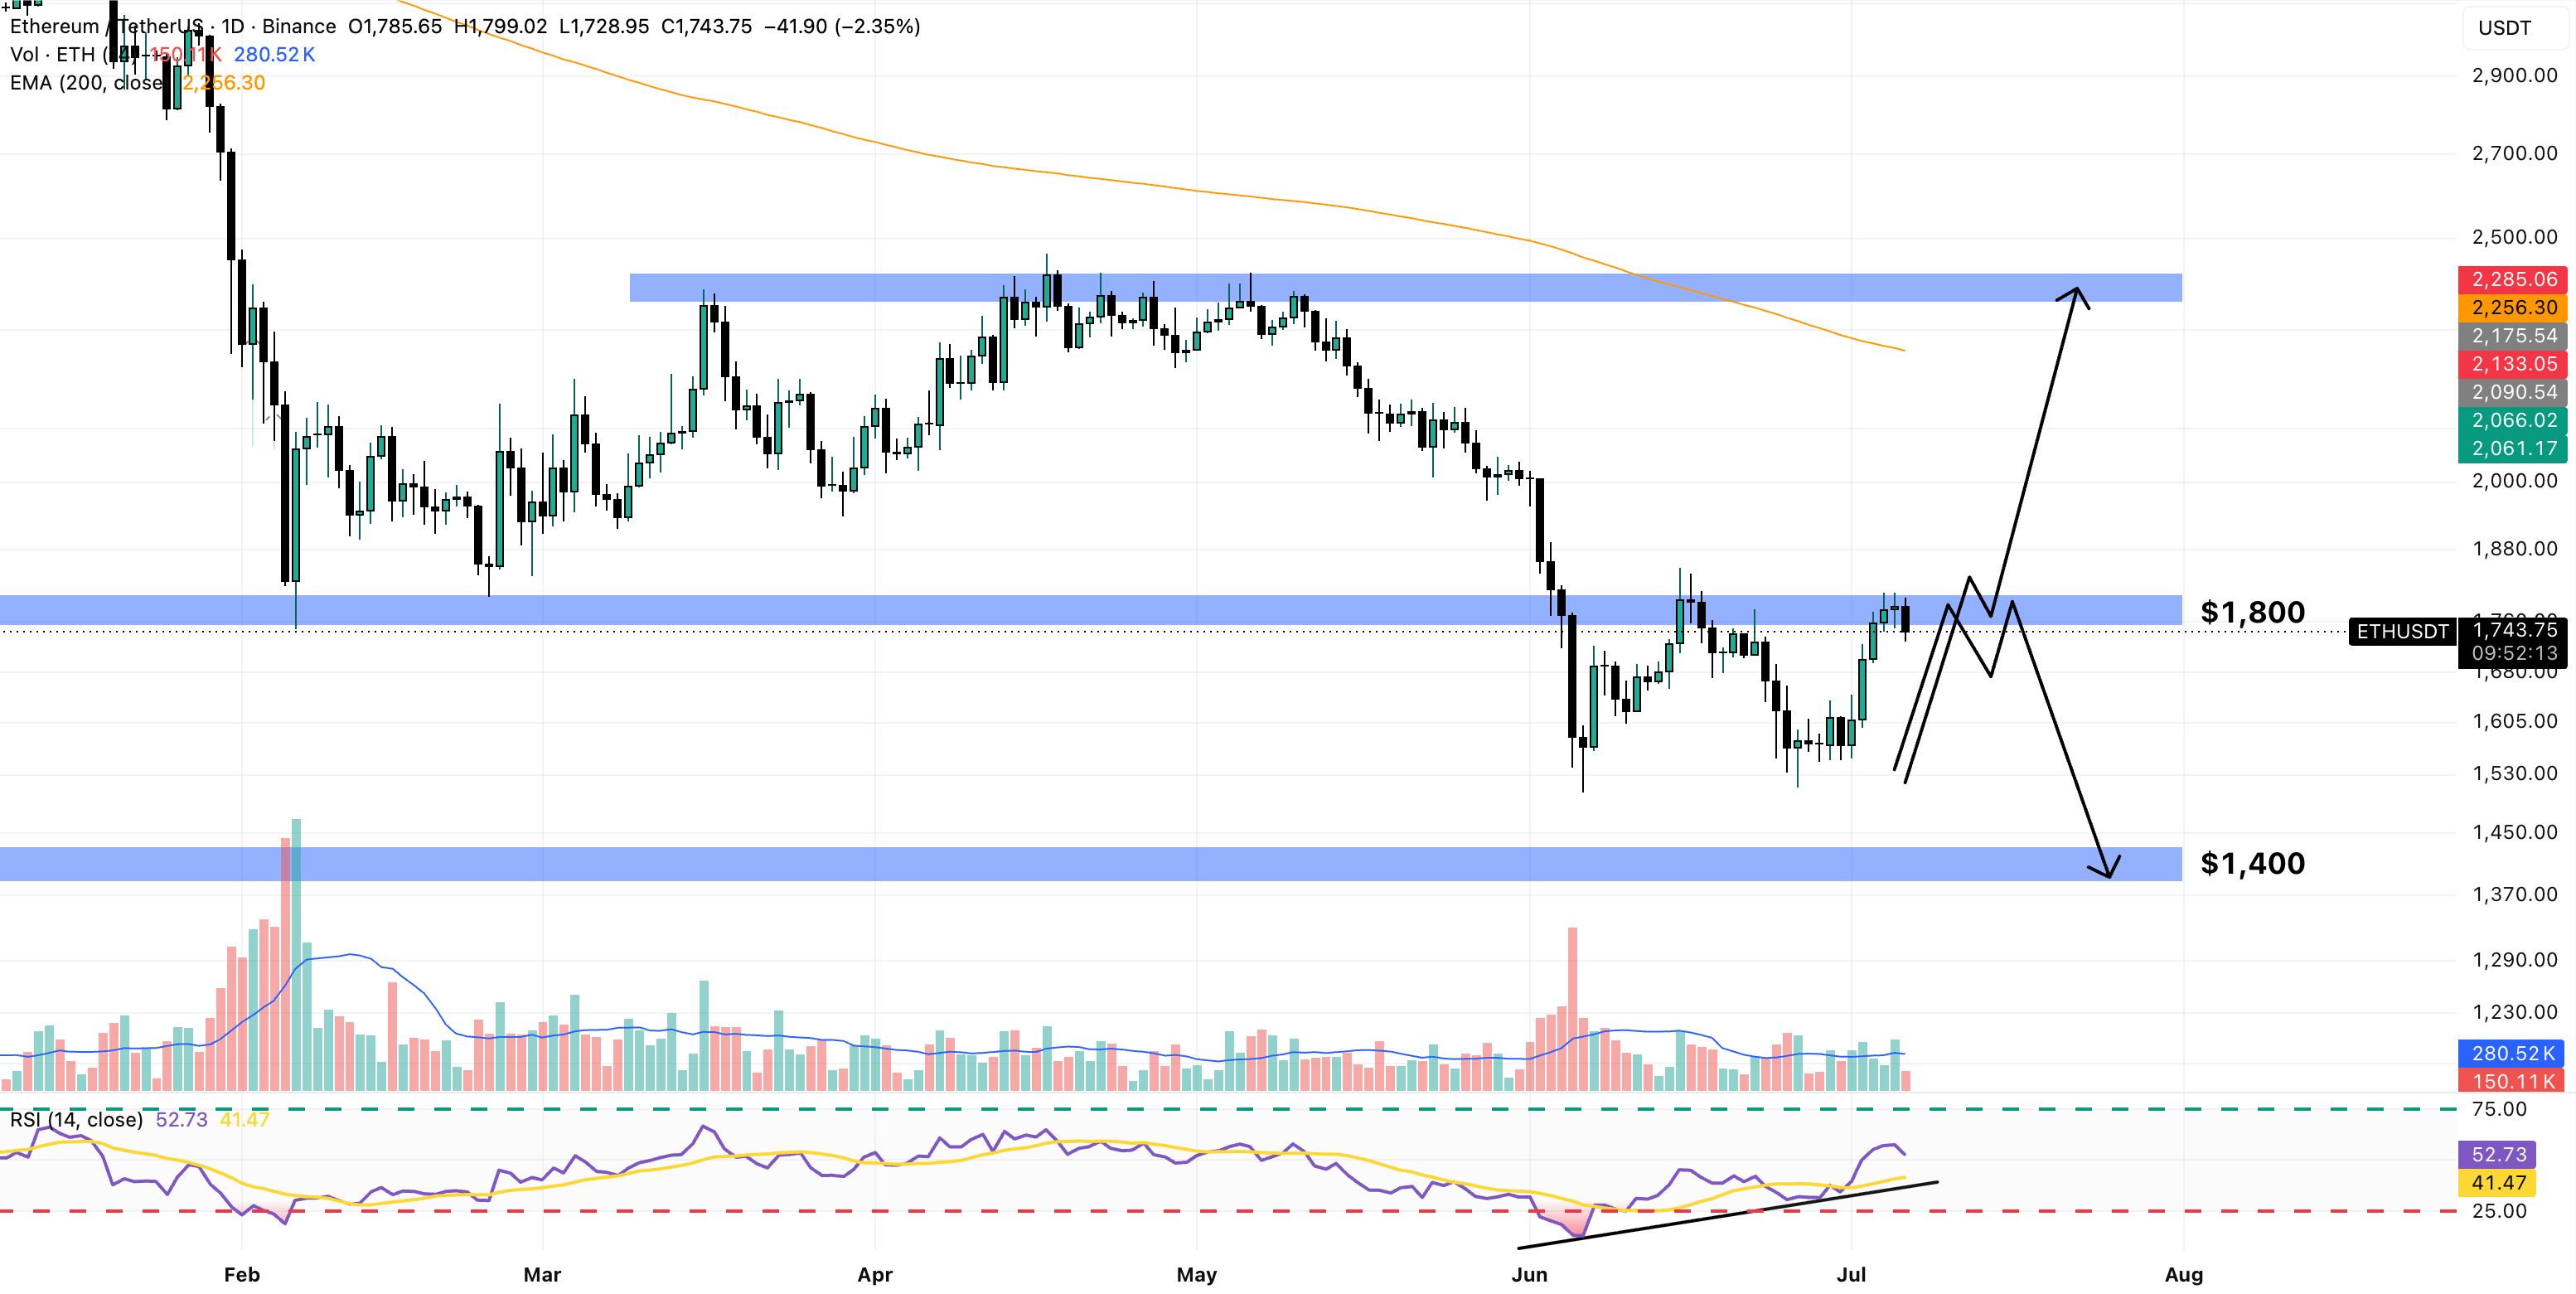
We will be monitoring how the price action behaves after this initial spike in the selling pressure. The American session should define the overall tone. Depending on whether the price recovers or the selling spree increases, that would confirm where ETH should be heading during the rest of the week.
A bullish divergence showed up recently in the RSI, potentially indicating that the price is ready to climb to higher levels.
However, a break above $1,800 is needed to confirm that signal. If that happens, then the token should set course to the 200-day exponential moving average (EMA) as part of a normal reversion to the mean move.