More than half of the tracked Bitcoin (BTC) supply is now underwater, a rare zone associated with major bear market bottoms in the past.

BTC Enters Bottom Formation Phase
As of Monday, July 6, only about 46% of Bitcoin’s circulating supply was sitting in profit, according to data resource CryptoQuant.
Bitcoin entered this broad profitability zone only six times since 2011, including during the 2015 and 2018 bear markets, the March 2020 crash, and the late-2022 capitulation.
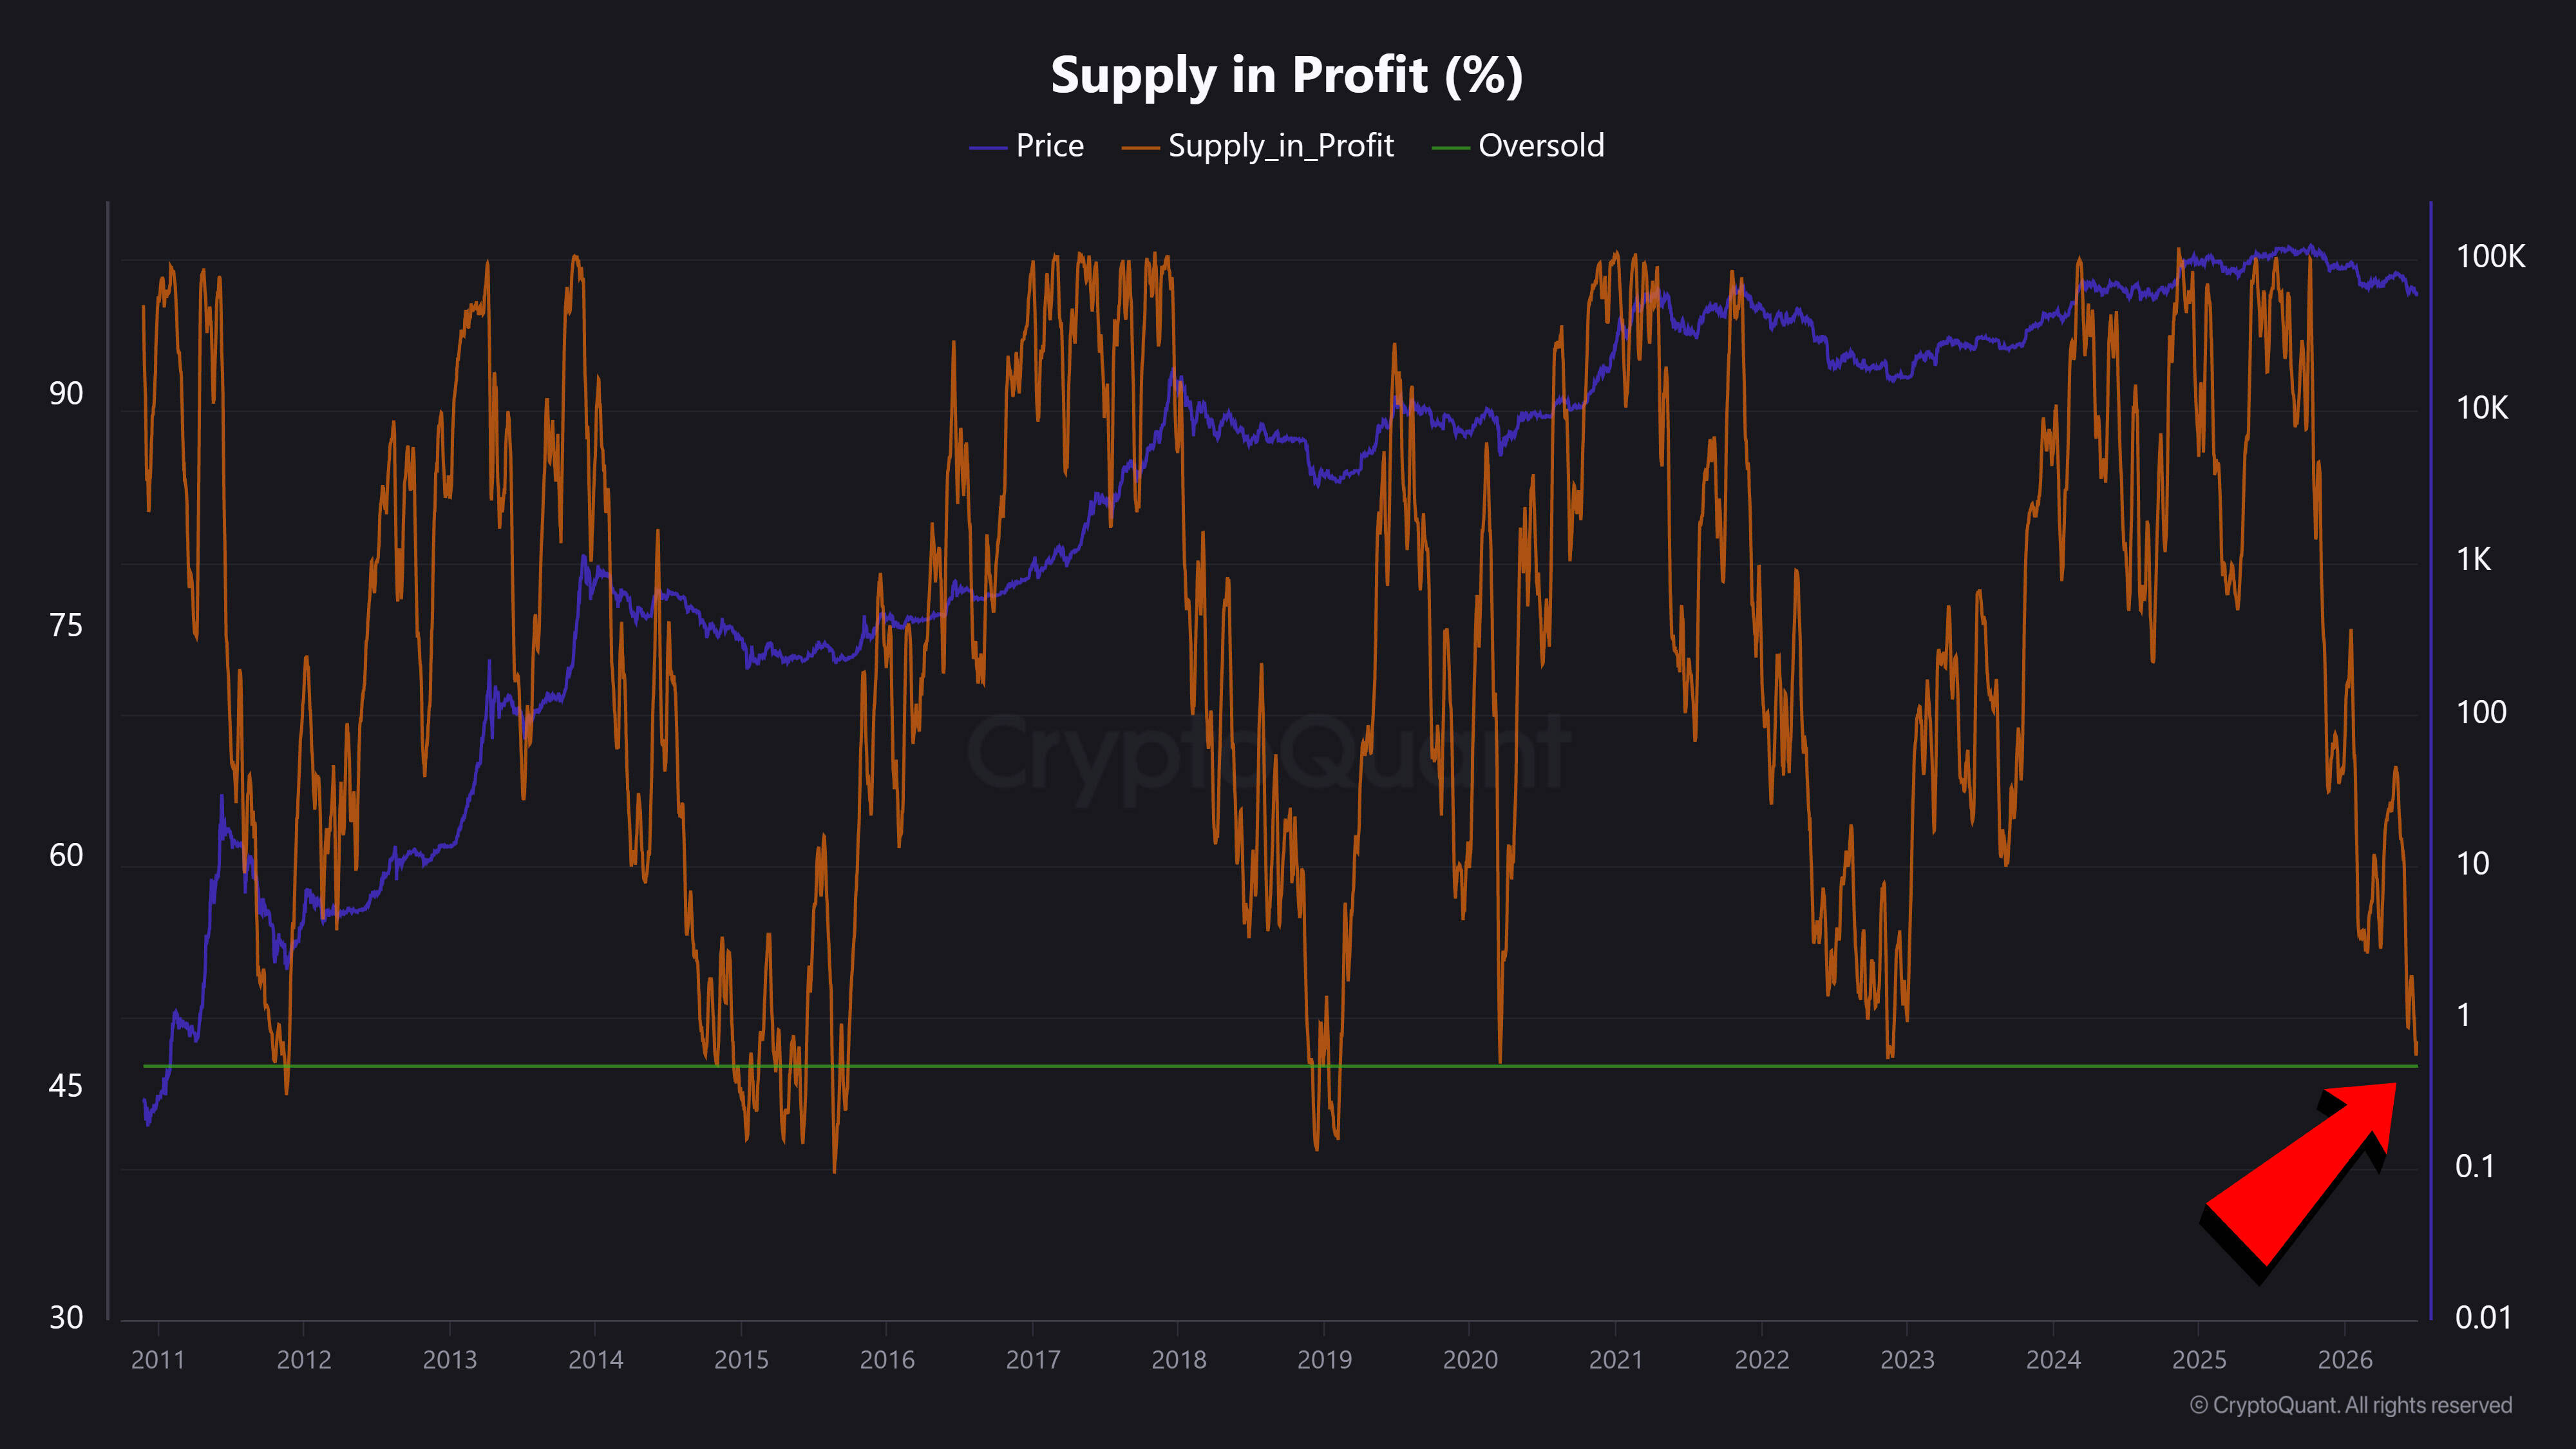
The previous instance occurred when BTC traded near $16,000 in late 2022. Bitcoin subsequently entered a multi-year recovery, rallying nearly 8x to above $125,000 by October 2025.
However, supply in profit is not a precise bottom signal. In previous cycles, the metric remained stuck near similar depressed levels for months before BTC finally established a macro low.
During the 2018 bear market, for instance, Bitcoin’s supply in profit stayed compressed before BTC bottomed near $3,122 in December. Price then rebounded to about $13,880 by June 2019, marking a roughly 345% recovery in six months.
A similar profitability reset occurred during the March 2020 crash, when Bitcoin plunged to around $3,850. BTC doubled within six weeks and ended the year near $29,000, up roughly 650% from the crash low.
Bitcoin Price Forecast
Every new Bitcoin analysis as it publishes, today's technical signal and key levels, live price — on one page.
See all Bitcoin forecastsBitcoin Rising Wedge Risks Drop Toward $59,000
Bitcoin’s short-term chart, however, warns that the capitulation signal may not immediately translate into a sustained rebound.
BTC is forming a rising wedge on the four-hour chart, with price compressing between two converging ascending trendlines after rebounding from the late-June low near $58,000. Rising wedges typically resolve lower when buyers lose momentum despite higher highs and higher lows.
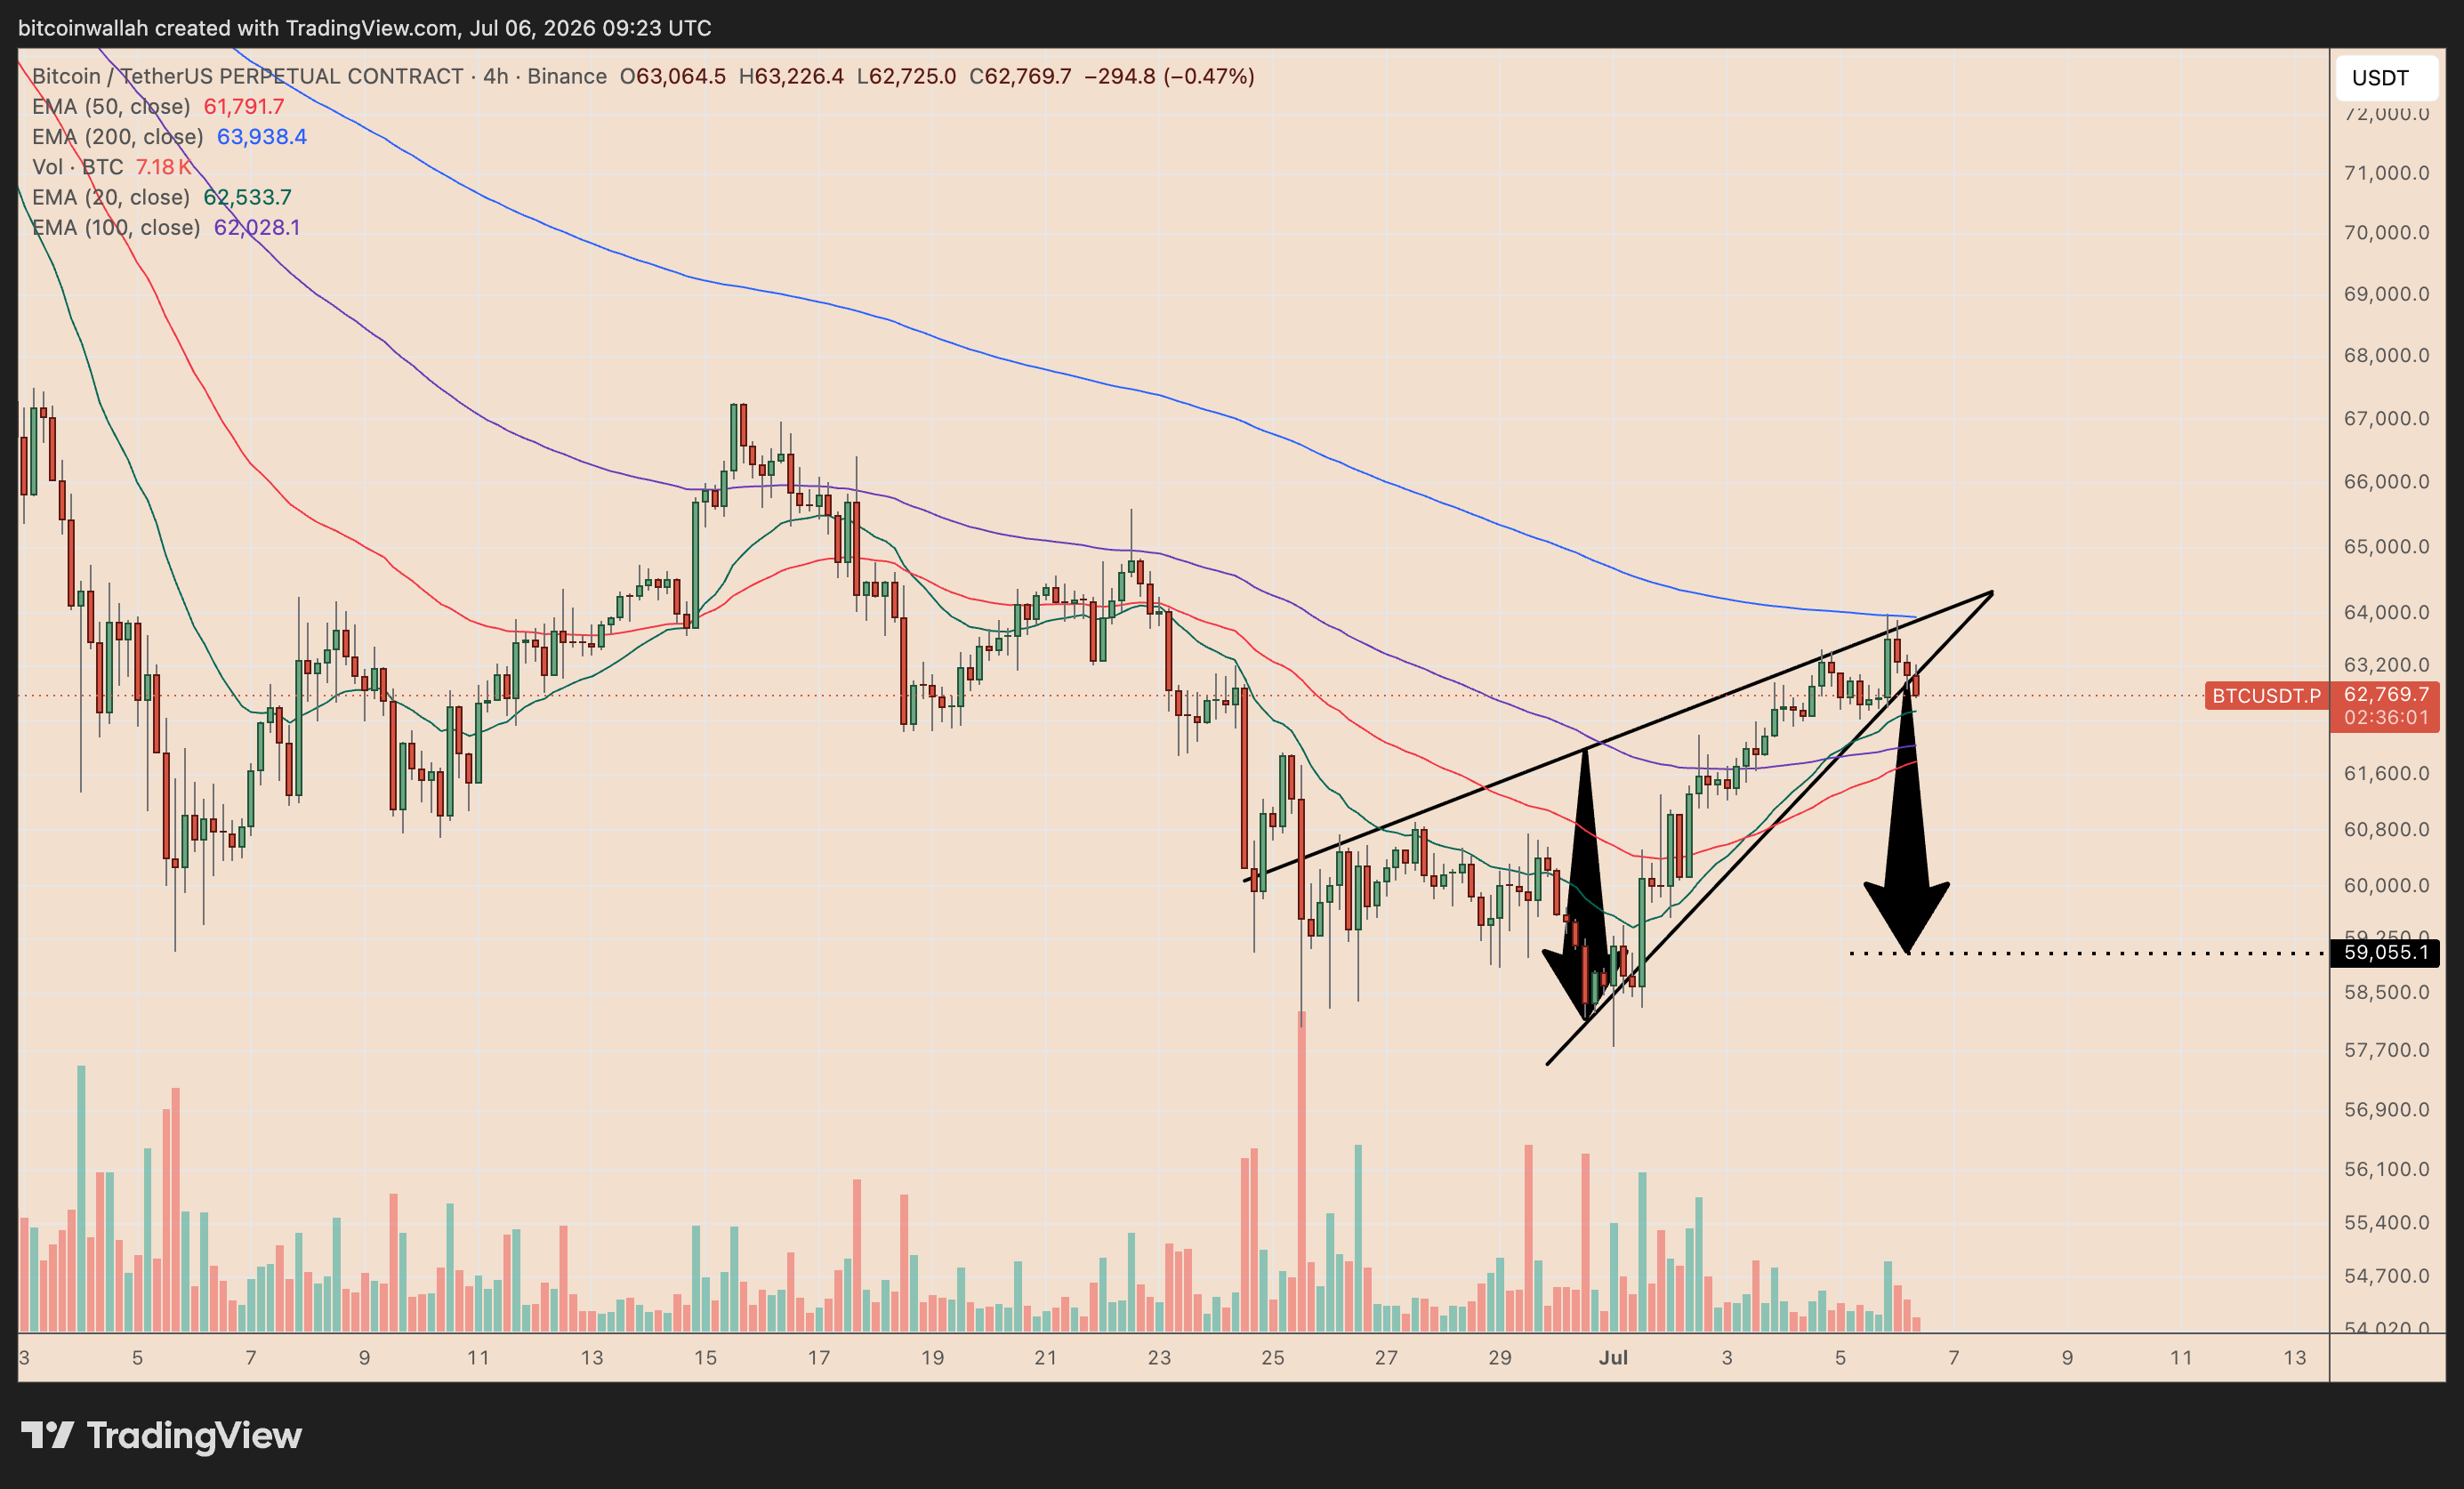
Bitcoin is also struggling near the 200-4H EMA around $63,940, reinforcing resistance near the wedge’s upper boundary.
A decisive breakdown below the pattern’s lower trendline could send BTC toward $59,000, broadly matching the wedge’s measured downside target. That would amount to a roughly 6% decline from current levels near $62,770.
Such a pullback would also fit the supply-in-profit thesis: historically depressed profitability can signal capitulation without marking the exact price bottom.