
Currencies Reflect Divergent Monetary Policies and Economic Fundamentals
As of July 6, the US dollar, euro and pound are all still being shaped by the mix of monetary policy directions being adopted and conditions at home. The US dollar continues to enjoy fundamental support, largely as a result of the Fed’s relatively more hawkish policy direction in the face of high underlying price pressures. This in turn is reinforcing market expectations of a prolonged phase of higher policy rates. It is also receiving ongoing support from domestic demand dynamics and the US dollar’s continued status as a reserve currency.
The euro continues to reflect mixed conditions with a more uneven pattern of recovery across the euro zone while the ECB strives to deliver on its medium-term inflation target. Different national fiscal positions and patterns of inflation across the euro zone have contributed to a more mixed monetary policy, meaning that the euro remains sensitive to growth and wage dynamics.
The pound is similarly underpinned by mixed economic data, with services price pressures at a relatively high level but growth slowing to a more tepid rate. The key fundamentals in play remain the UK’s own fiscal and labour market situation, in addition to any shifts in the monetary policy directions of the US and euro zones in relation to the UK.
The mixed conditions prevailing in the US, the euro zone and the UK mean that the fundamental drivers remain unchanged, particularly in terms of inflation, the strength of the respective fiscal situation and growth. The result is that the US dollar, the euro and the pound are all experiencing mixed developments in terms of domestic monetary policy and in terms of their relative trading positions.

DXY Holds $101.03 – Green Triangle Breakout Test on 1D
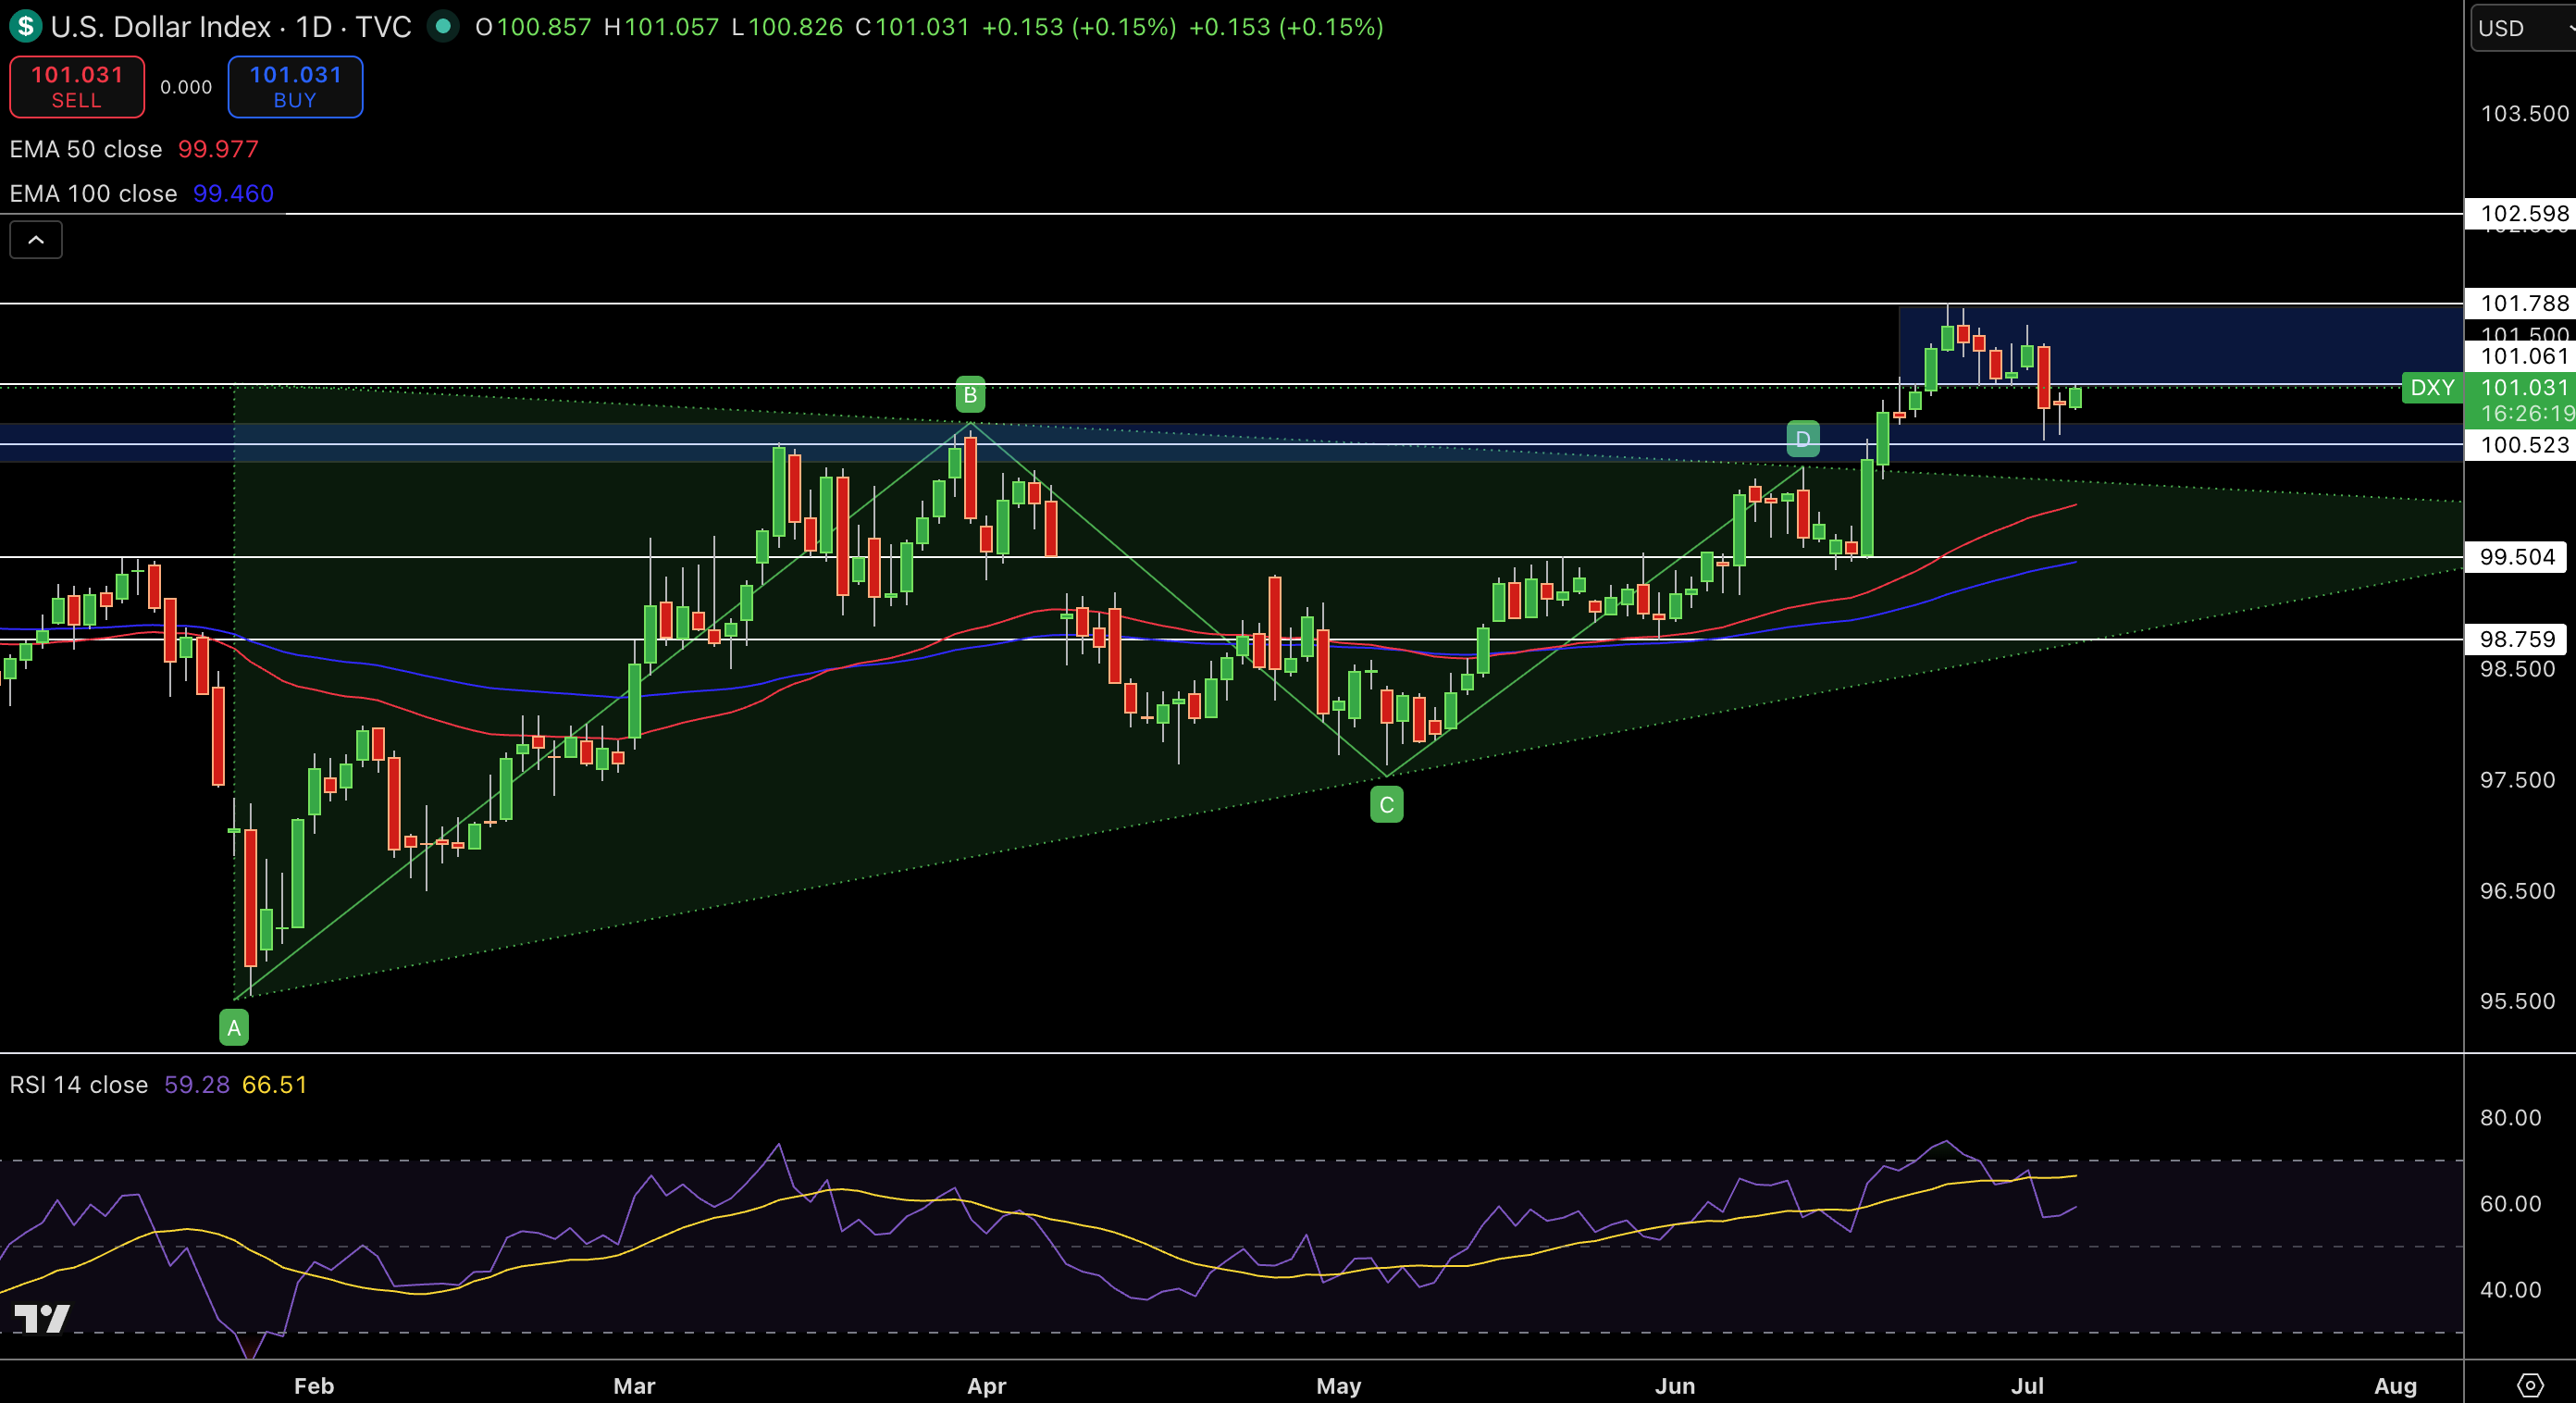
DXY holds at $101.03, currently testing the green triangle resistance at $100.36 on the daily chart. Since breaking out decisively from the $97.67 swing high, the pair has printed green continuation candles. These bars have been challenging the trendline resistance while putting in higher highs on bullish bodies, a sign that buyers are in full control and respecting the white ascending trendline.
At 59 RSI, which is currently sitting between neutral and bullish, $100.36 stands out as the key breakout pivot on the volume profile. Above that level, price has been making higher highs and higher lows within a nice ascending channel to $103.09 over the coming weeks.
Trade Idea: Enter Buy at $101.03, set stop loss at $100.36, and aim for $103.09.
GBP/USD Price Forecast
Every new GBP/USD analysis as it publishes, today's technical signal and key levels, live price — on one page.
See all GBP/USD forecastsGBP/USD Holds $1.3337 – White Ascending Trendline Defense on 2h
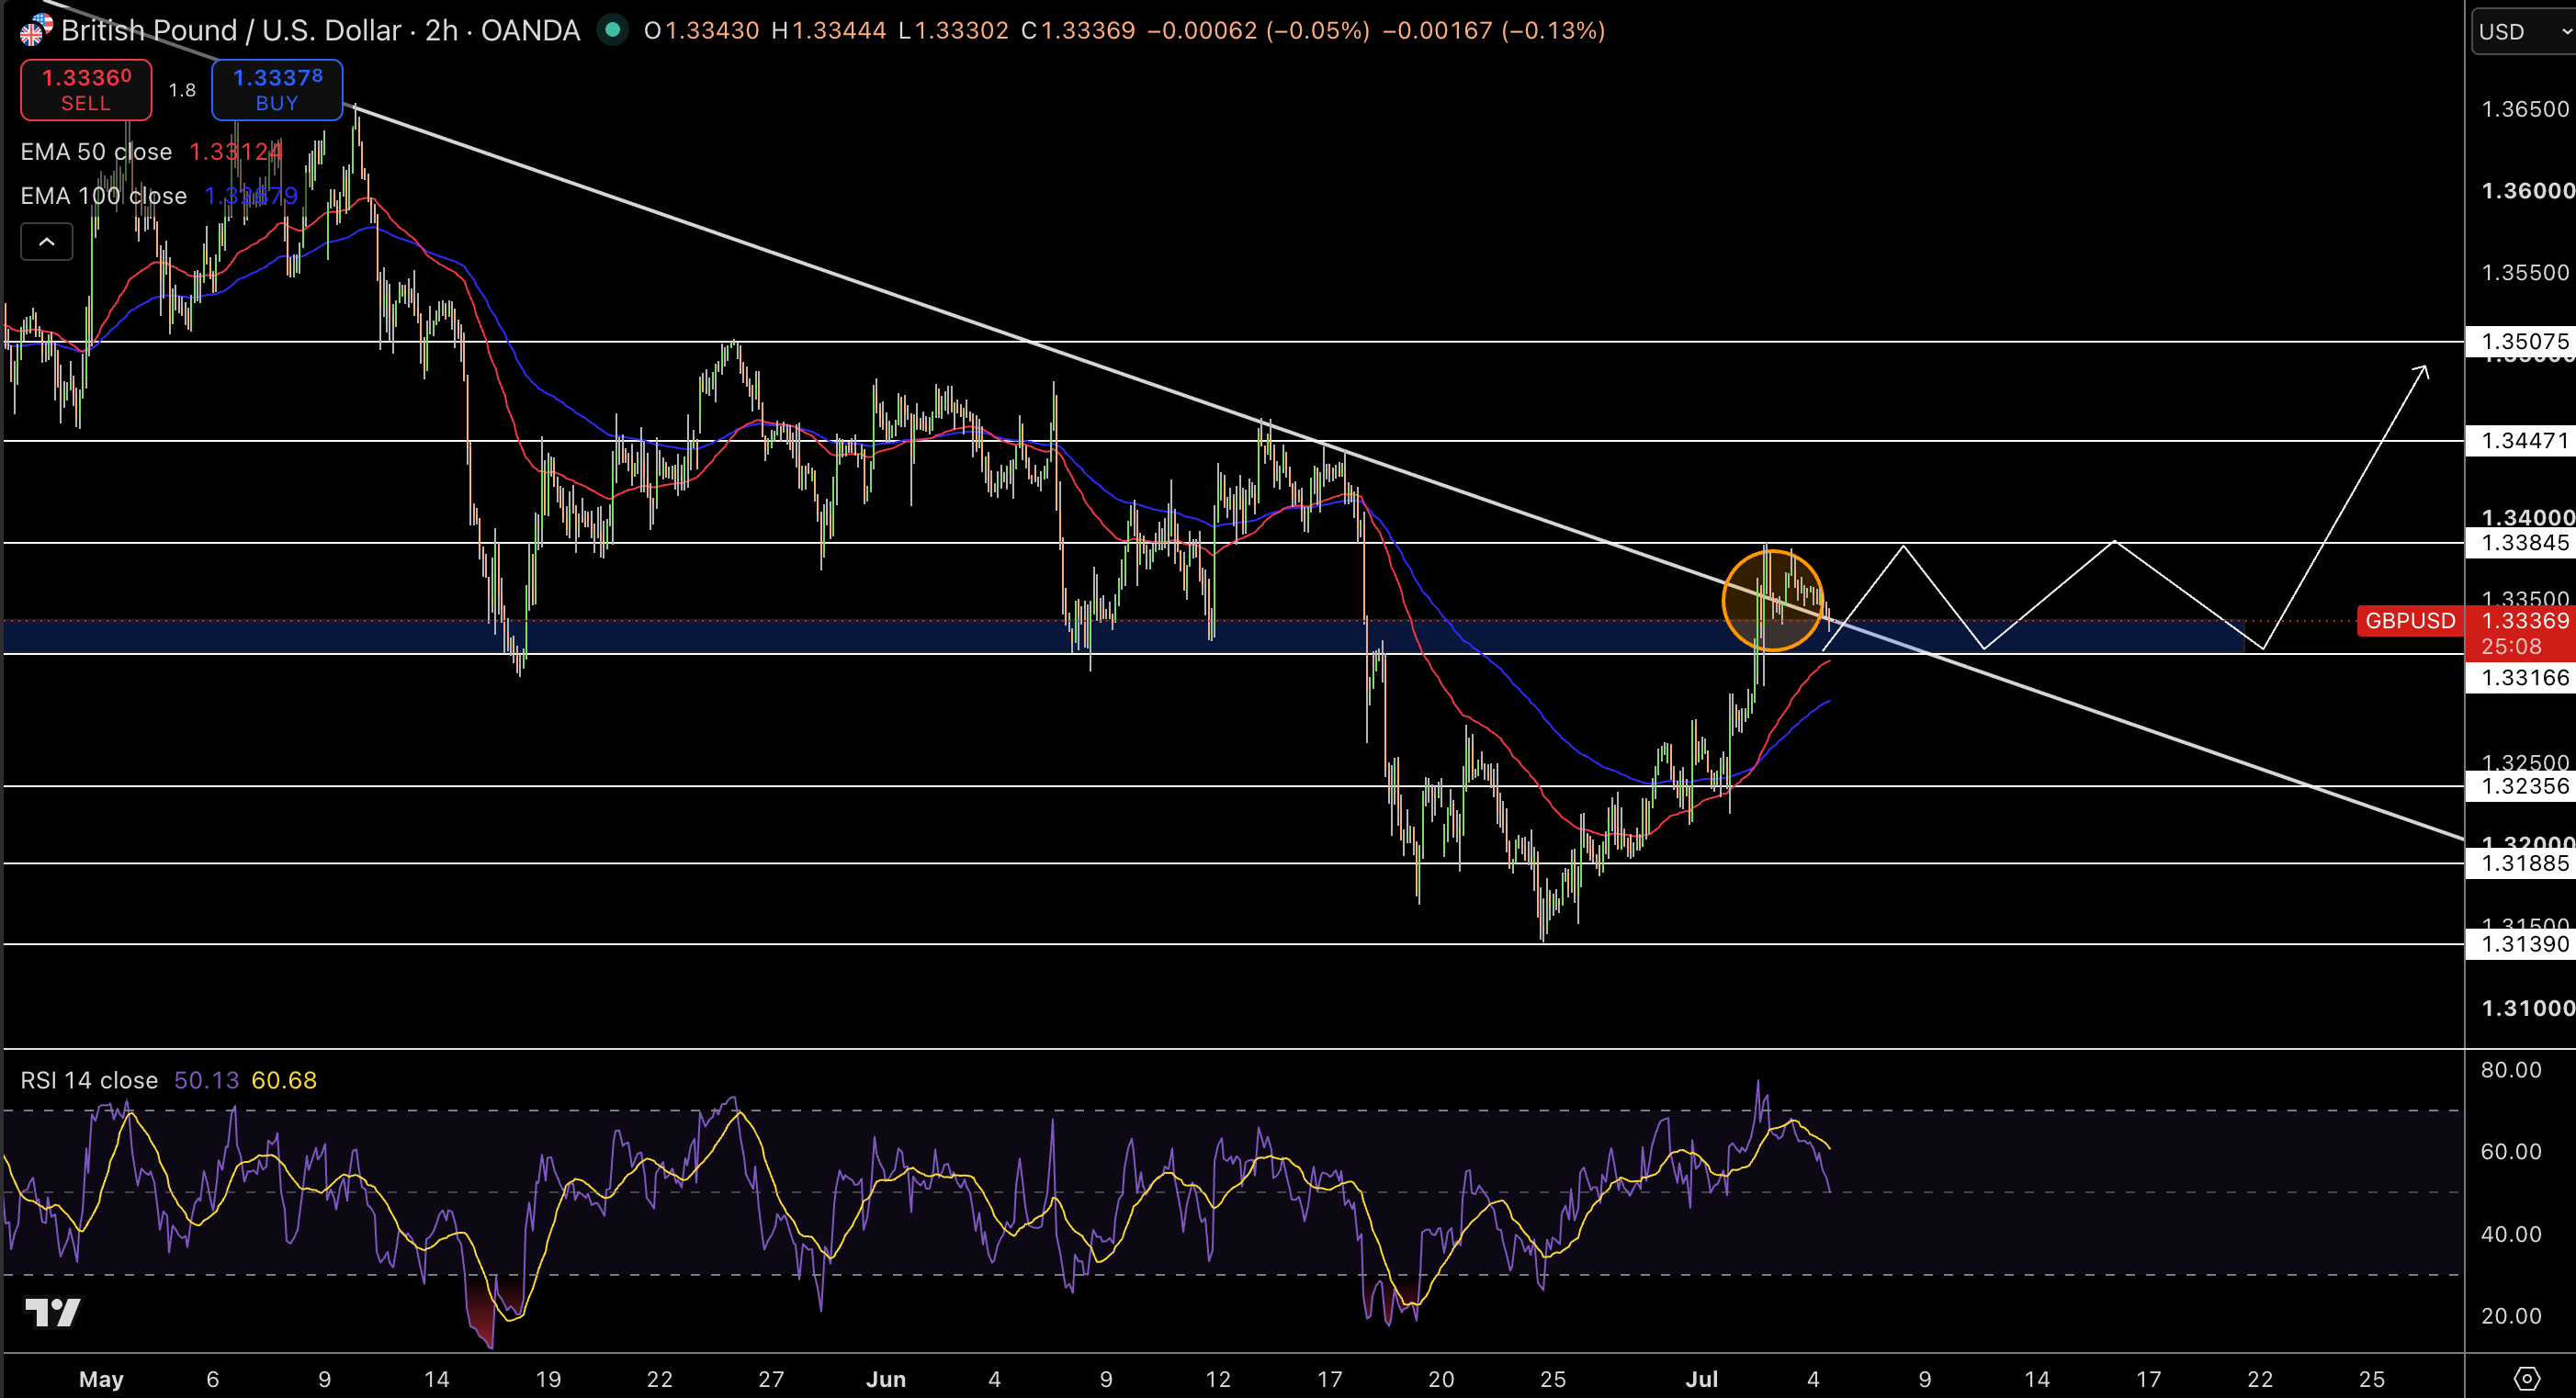
GBP/USD stands at $1.3337 on the 2H chart and is currently defending a white ascending trendline at $1.3317 after being rejected by the red MA at $1.337. Mixed candles with bullish rejection wicks suggest that buyers are absorbing sellers on the trendline while making a higher low.
The RSI is at 61 while the volume profile reveals $1.330 to $1.335 to be a pivot. The next resistance area is projected at $1.338 and $1.345. The trendline structure remains neutral and bullish within the channel.
Trade Idea: Enter Buy at $1.3337, stop at $1.320, and target $1.338.
EUR/USD Dips to $1.1425 – EMA 50 Defense on 2h
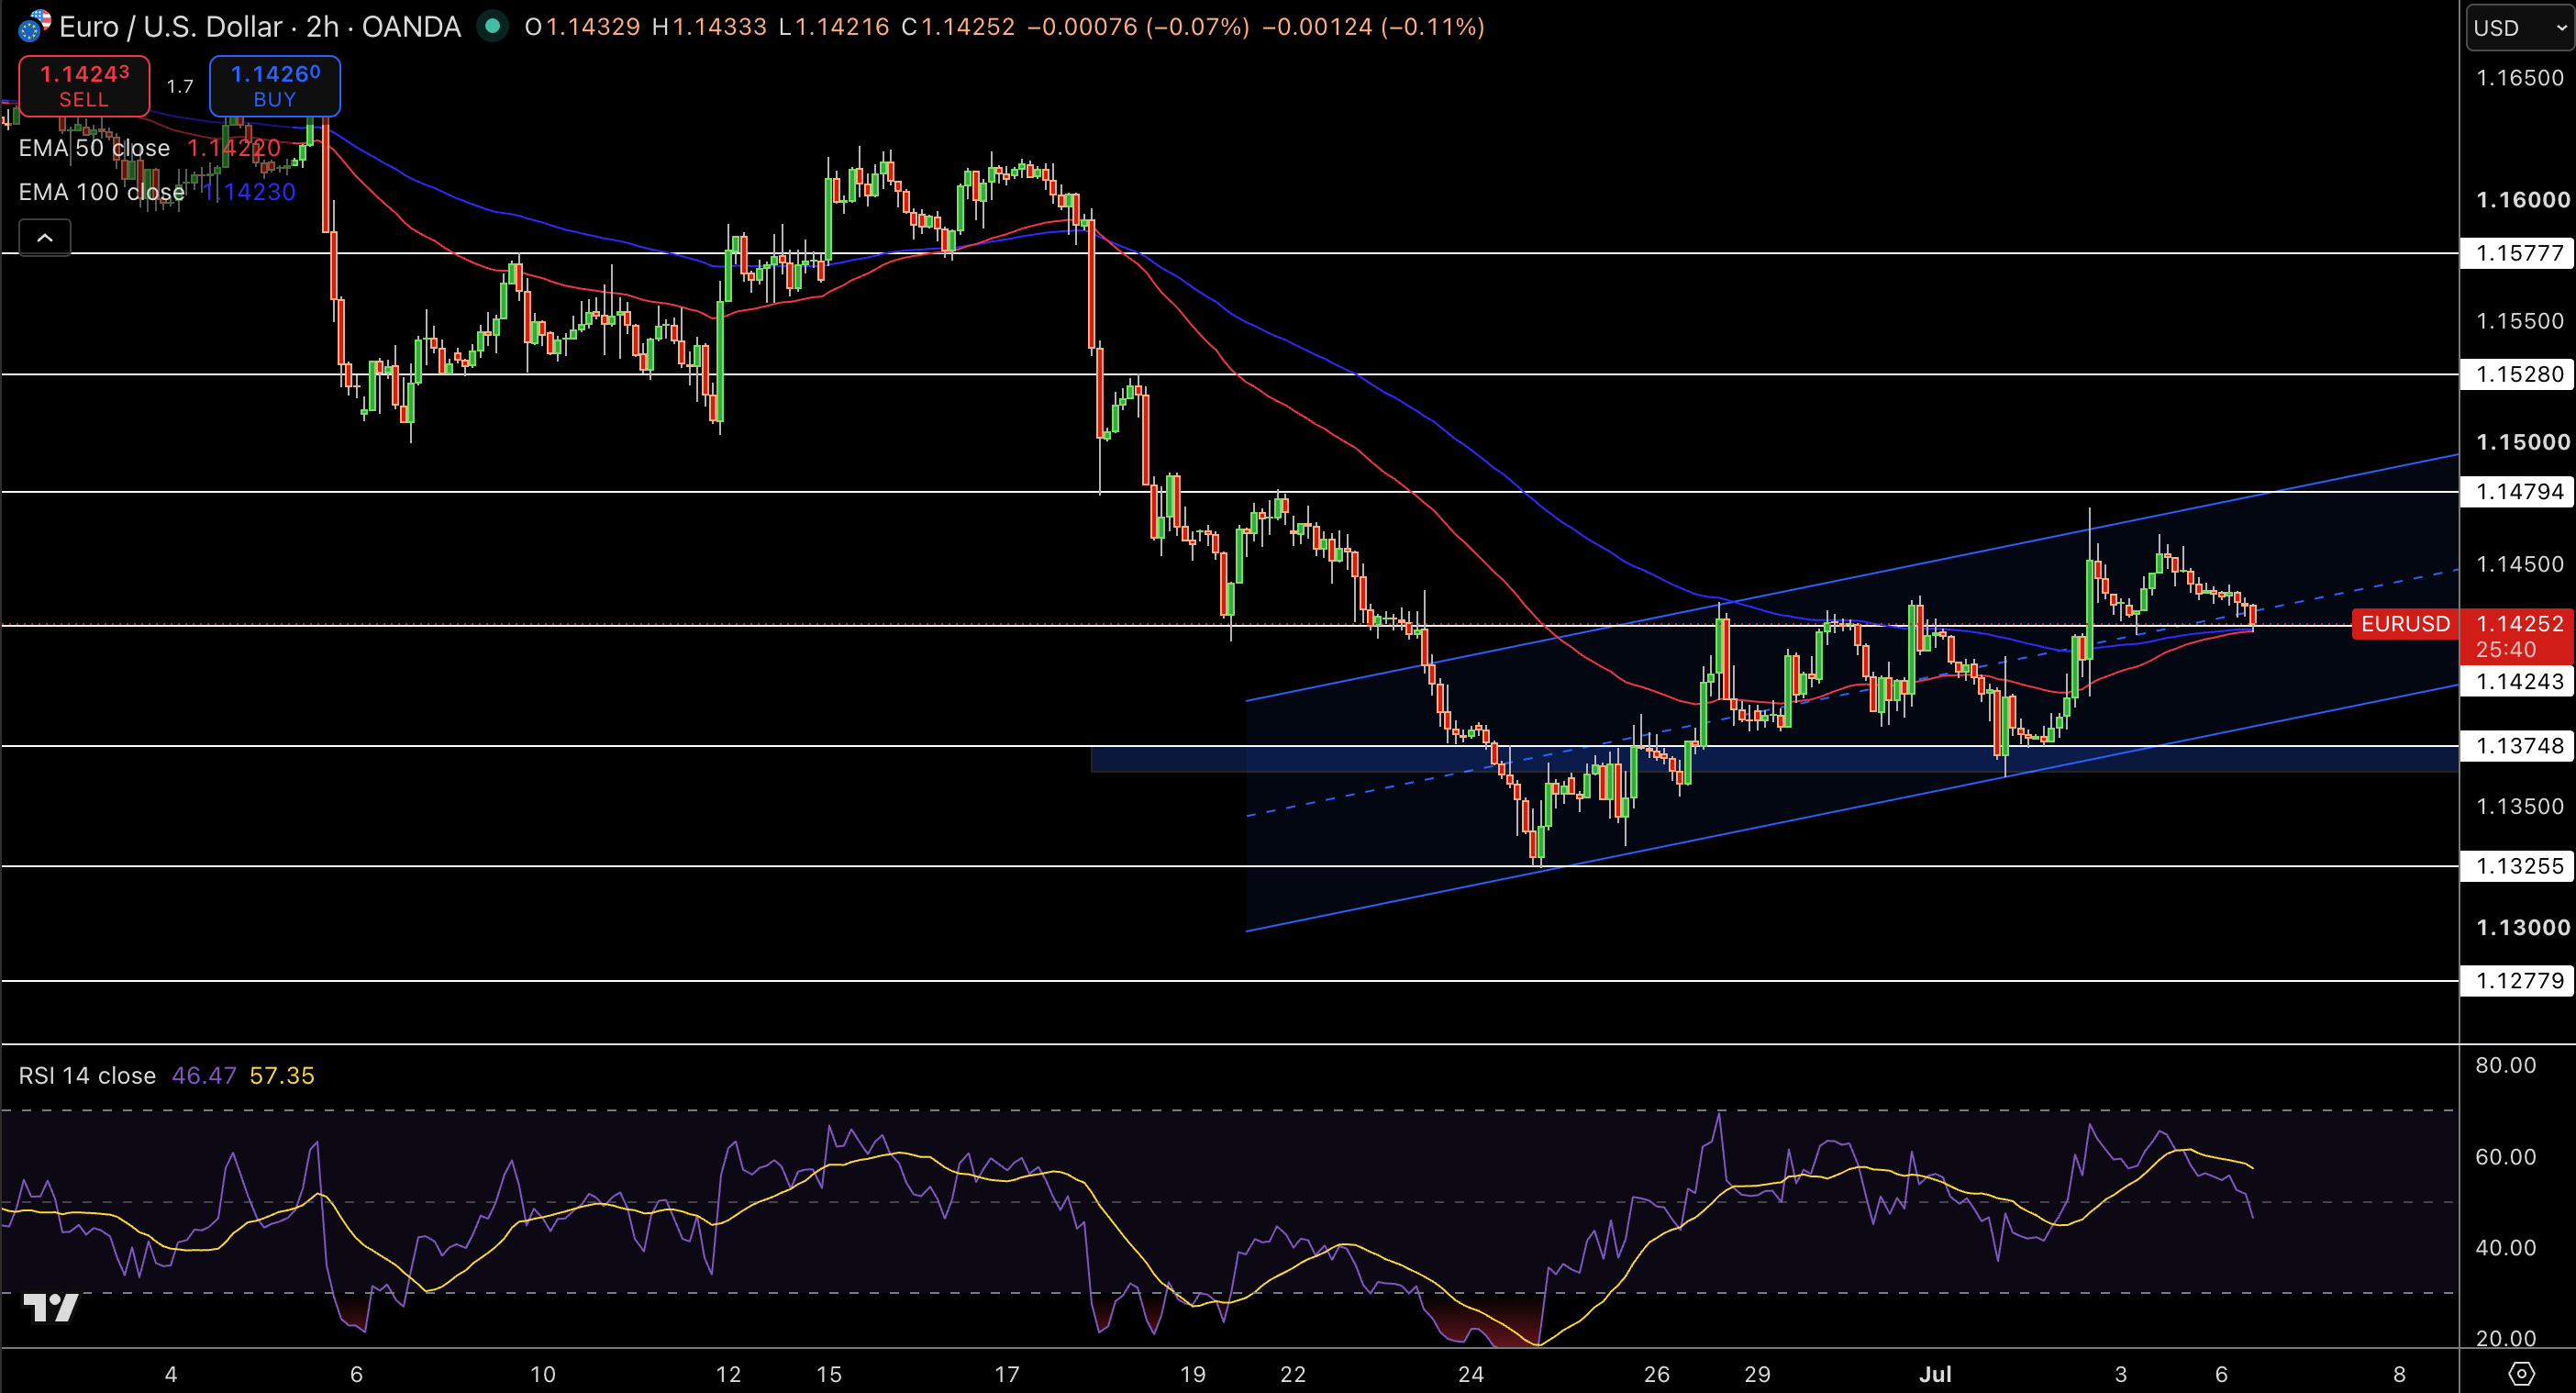
EUR/USD stands at $1.1425 on the 2H chart after selling off and rejecting the red MA at $1.162. Mixed candles are now defending the EMA 50 at $1.1422 and have bullish wicks at the lows while making higher lows. The RSI is currently at 57 and sits in the neutral and bullish territory.
The volume profile shows a pivot zone from $1.142 to $1.150 and shows that buyers may participate in the coming days if price is to pullback to this level. The next resistance area is located between $1.155 and $1.162. The structure above EMA 50 remains neutral and bullish against the prevailing downtrend.
Trade Idea: Buy $1.1425 with stop loss at $1.140 and target at $1.155.