



Precious Metals Fundamentals Supported by Central Bank Demand and Supply Limits
Gold and silver prices have had reliable support recently from central bank buying and limited growth in primary supply, as I note in our July 6 report. Central banks have been consistently adding gold and silver to their portfolios as part of portfolio diversification in an environment of elevated government debt levels and changing monetary and fiscal conditions. This support has persisted for several years, although it is independent of the longer-term investment demand trend.
In contrast, mine supply growth remains muted. Although gold mine supply has shown some growth over the past several years, silver has essentially been flat. Recycling supply can also support prices in a higher price environment.
Silver has had stronger growth in demand, with fabrication in solar energy and electronics driving an increase in investment demand. Investment demand from exchange-traded funds and coins and bars has also continued, reflecting trends in other asset classes, and central bank gold and silver purchases have provided reliable support for prices. Supply, demand and macro trends are shown in the supply and demand charts and tables that I discuss in our July 6 report.

Gold Spot Rises to $4,153 – Downward Trendline Breakout on 2h
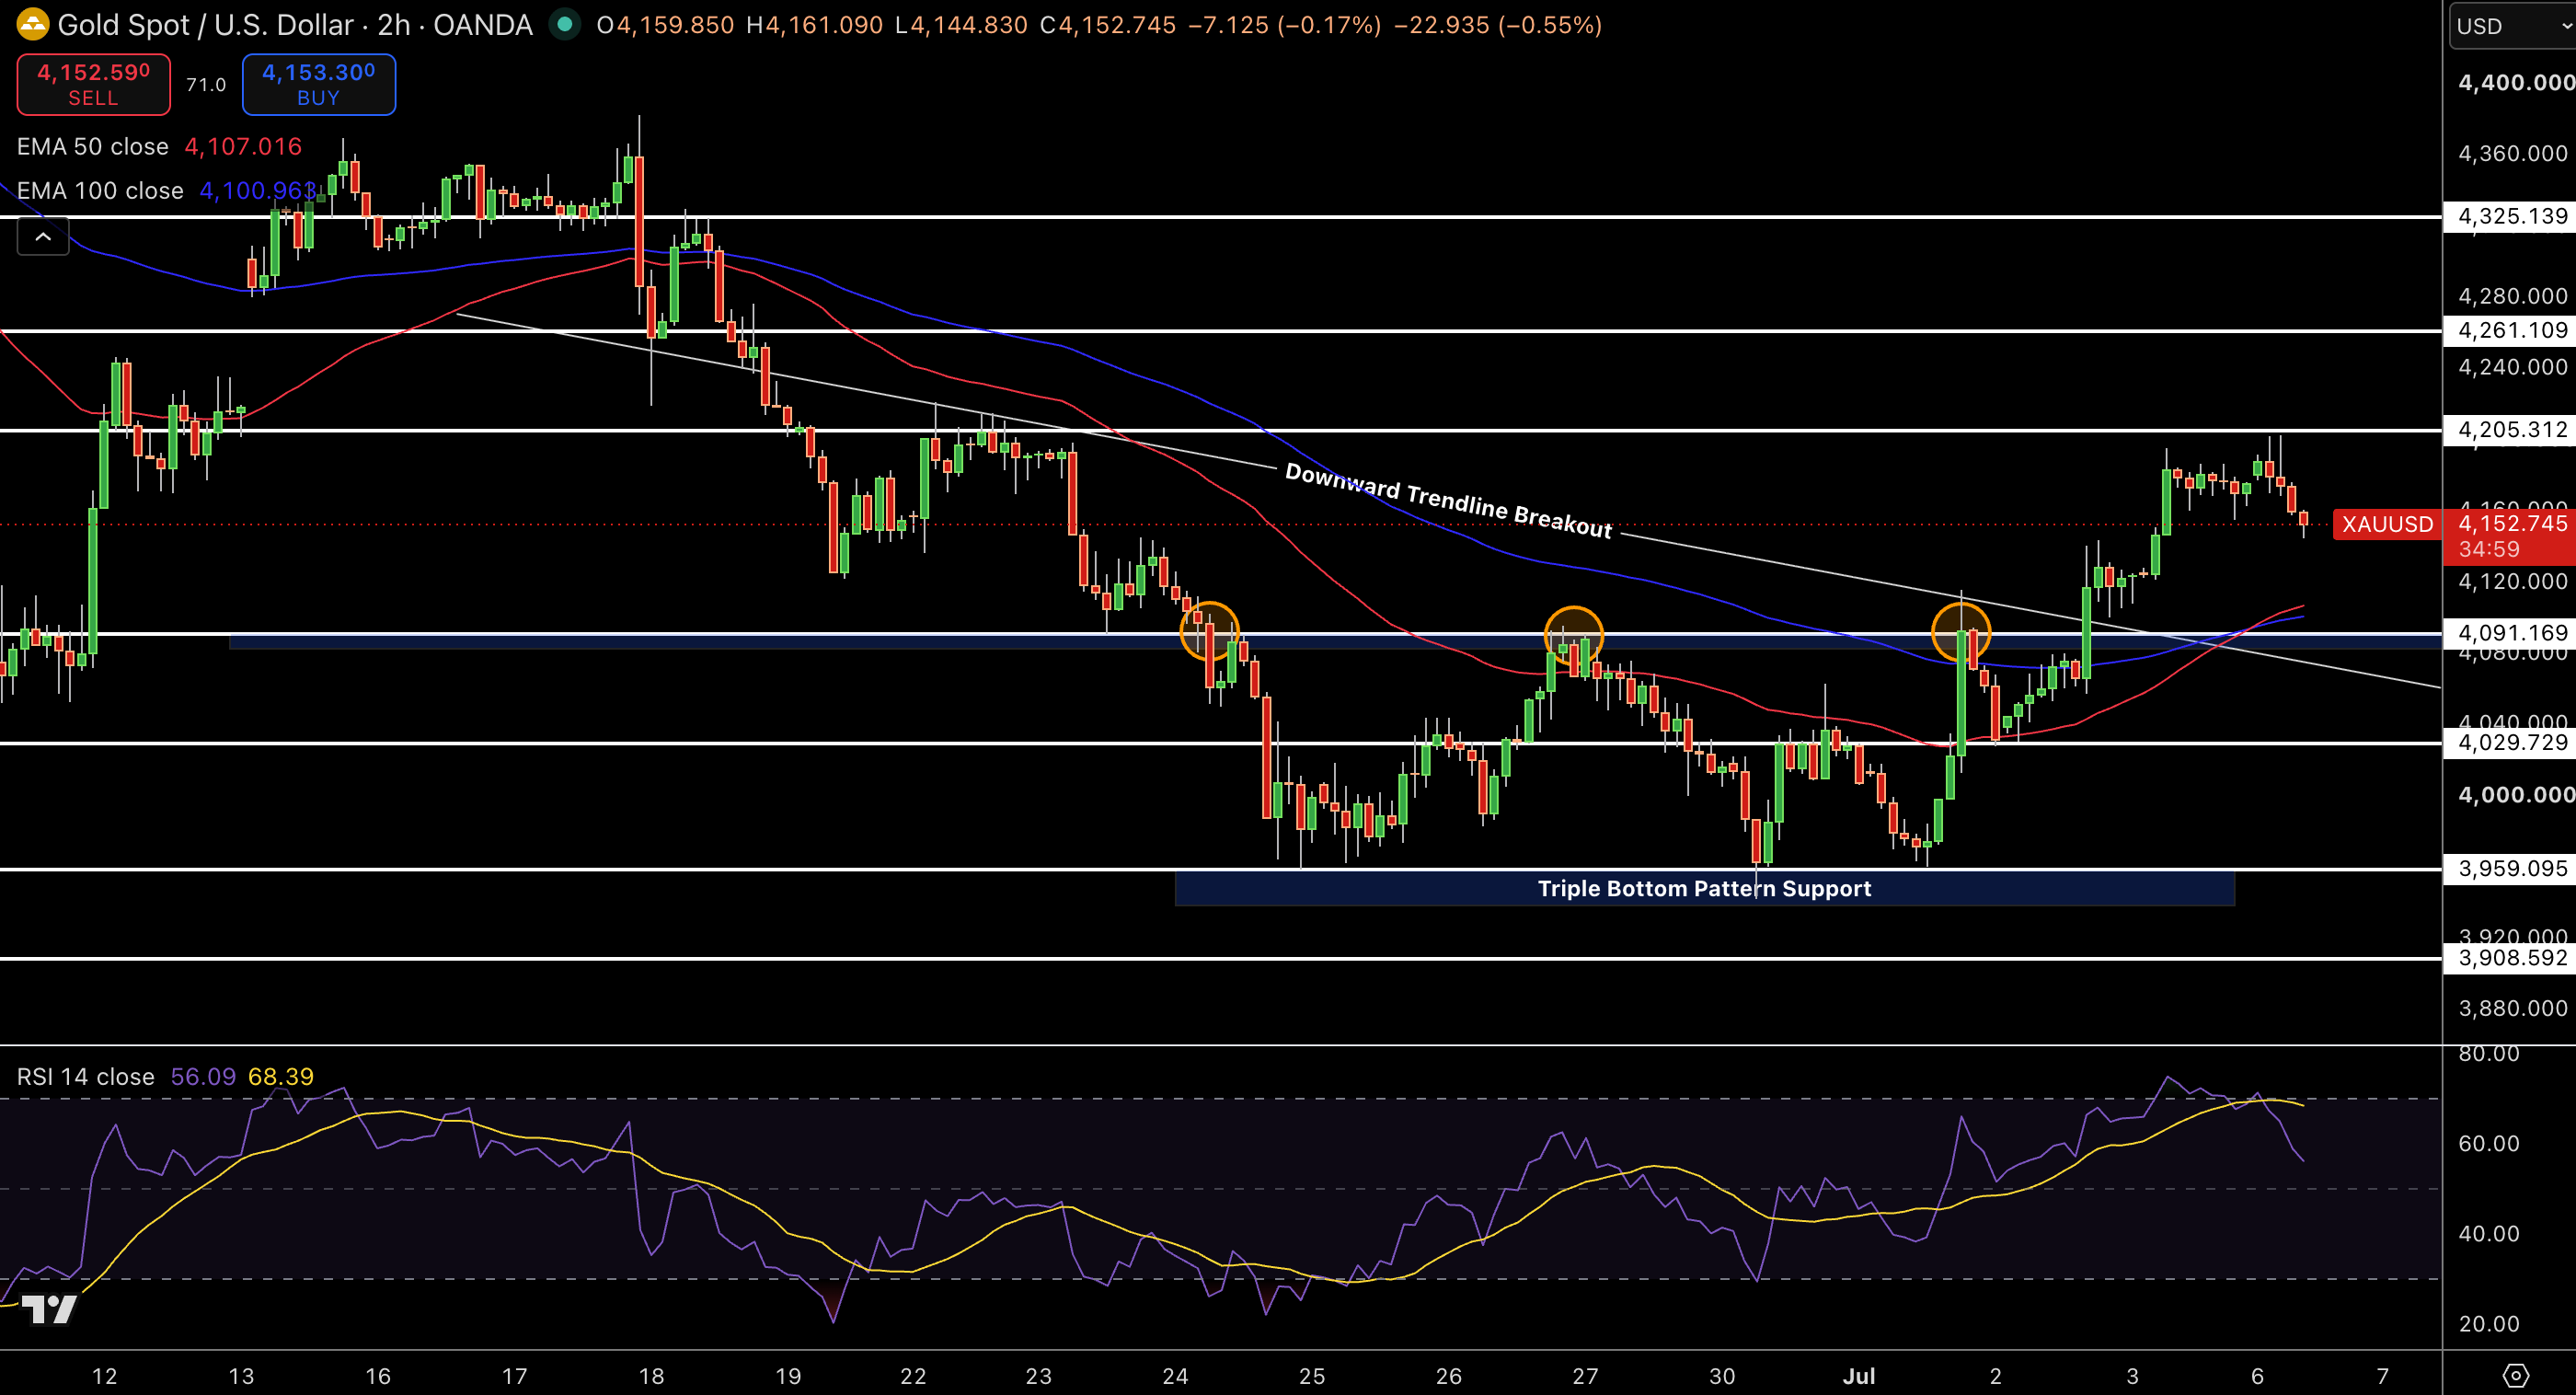
Gold Spot is currently quoted at $4,153 on the 2h timeframe. It surged past a downward trendline around $4,091 following a green candlestick breakout. A triple bottom support near $3,959 was held before green continuation candles pushed through.
Bullish reversal confirmation was printed as green engulfing candles produced higher highs. RSI at 57 is neutral-bullish. $4,000-4,091 was a strong buying area as seen on the volume profile. The Blue 50 EMA now stands near $4,074.
A bullish structure is now confirmed with the price trading above $4,091 while maintaining the broad down-channelling that began at $4,597 highs. Short-term support and resistance targets line up as higher lows develop.
Trade Idea: Buy $4,153 with $4,201 target & $4,091 stop.
Gold Price Forecast
Every new Gold analysis as it publishes, today's technical signal and key levels, live price — on one page.
See all Gold forecastsSilver Spot Rises to $61.90 – EMA 50 Defense on 2h
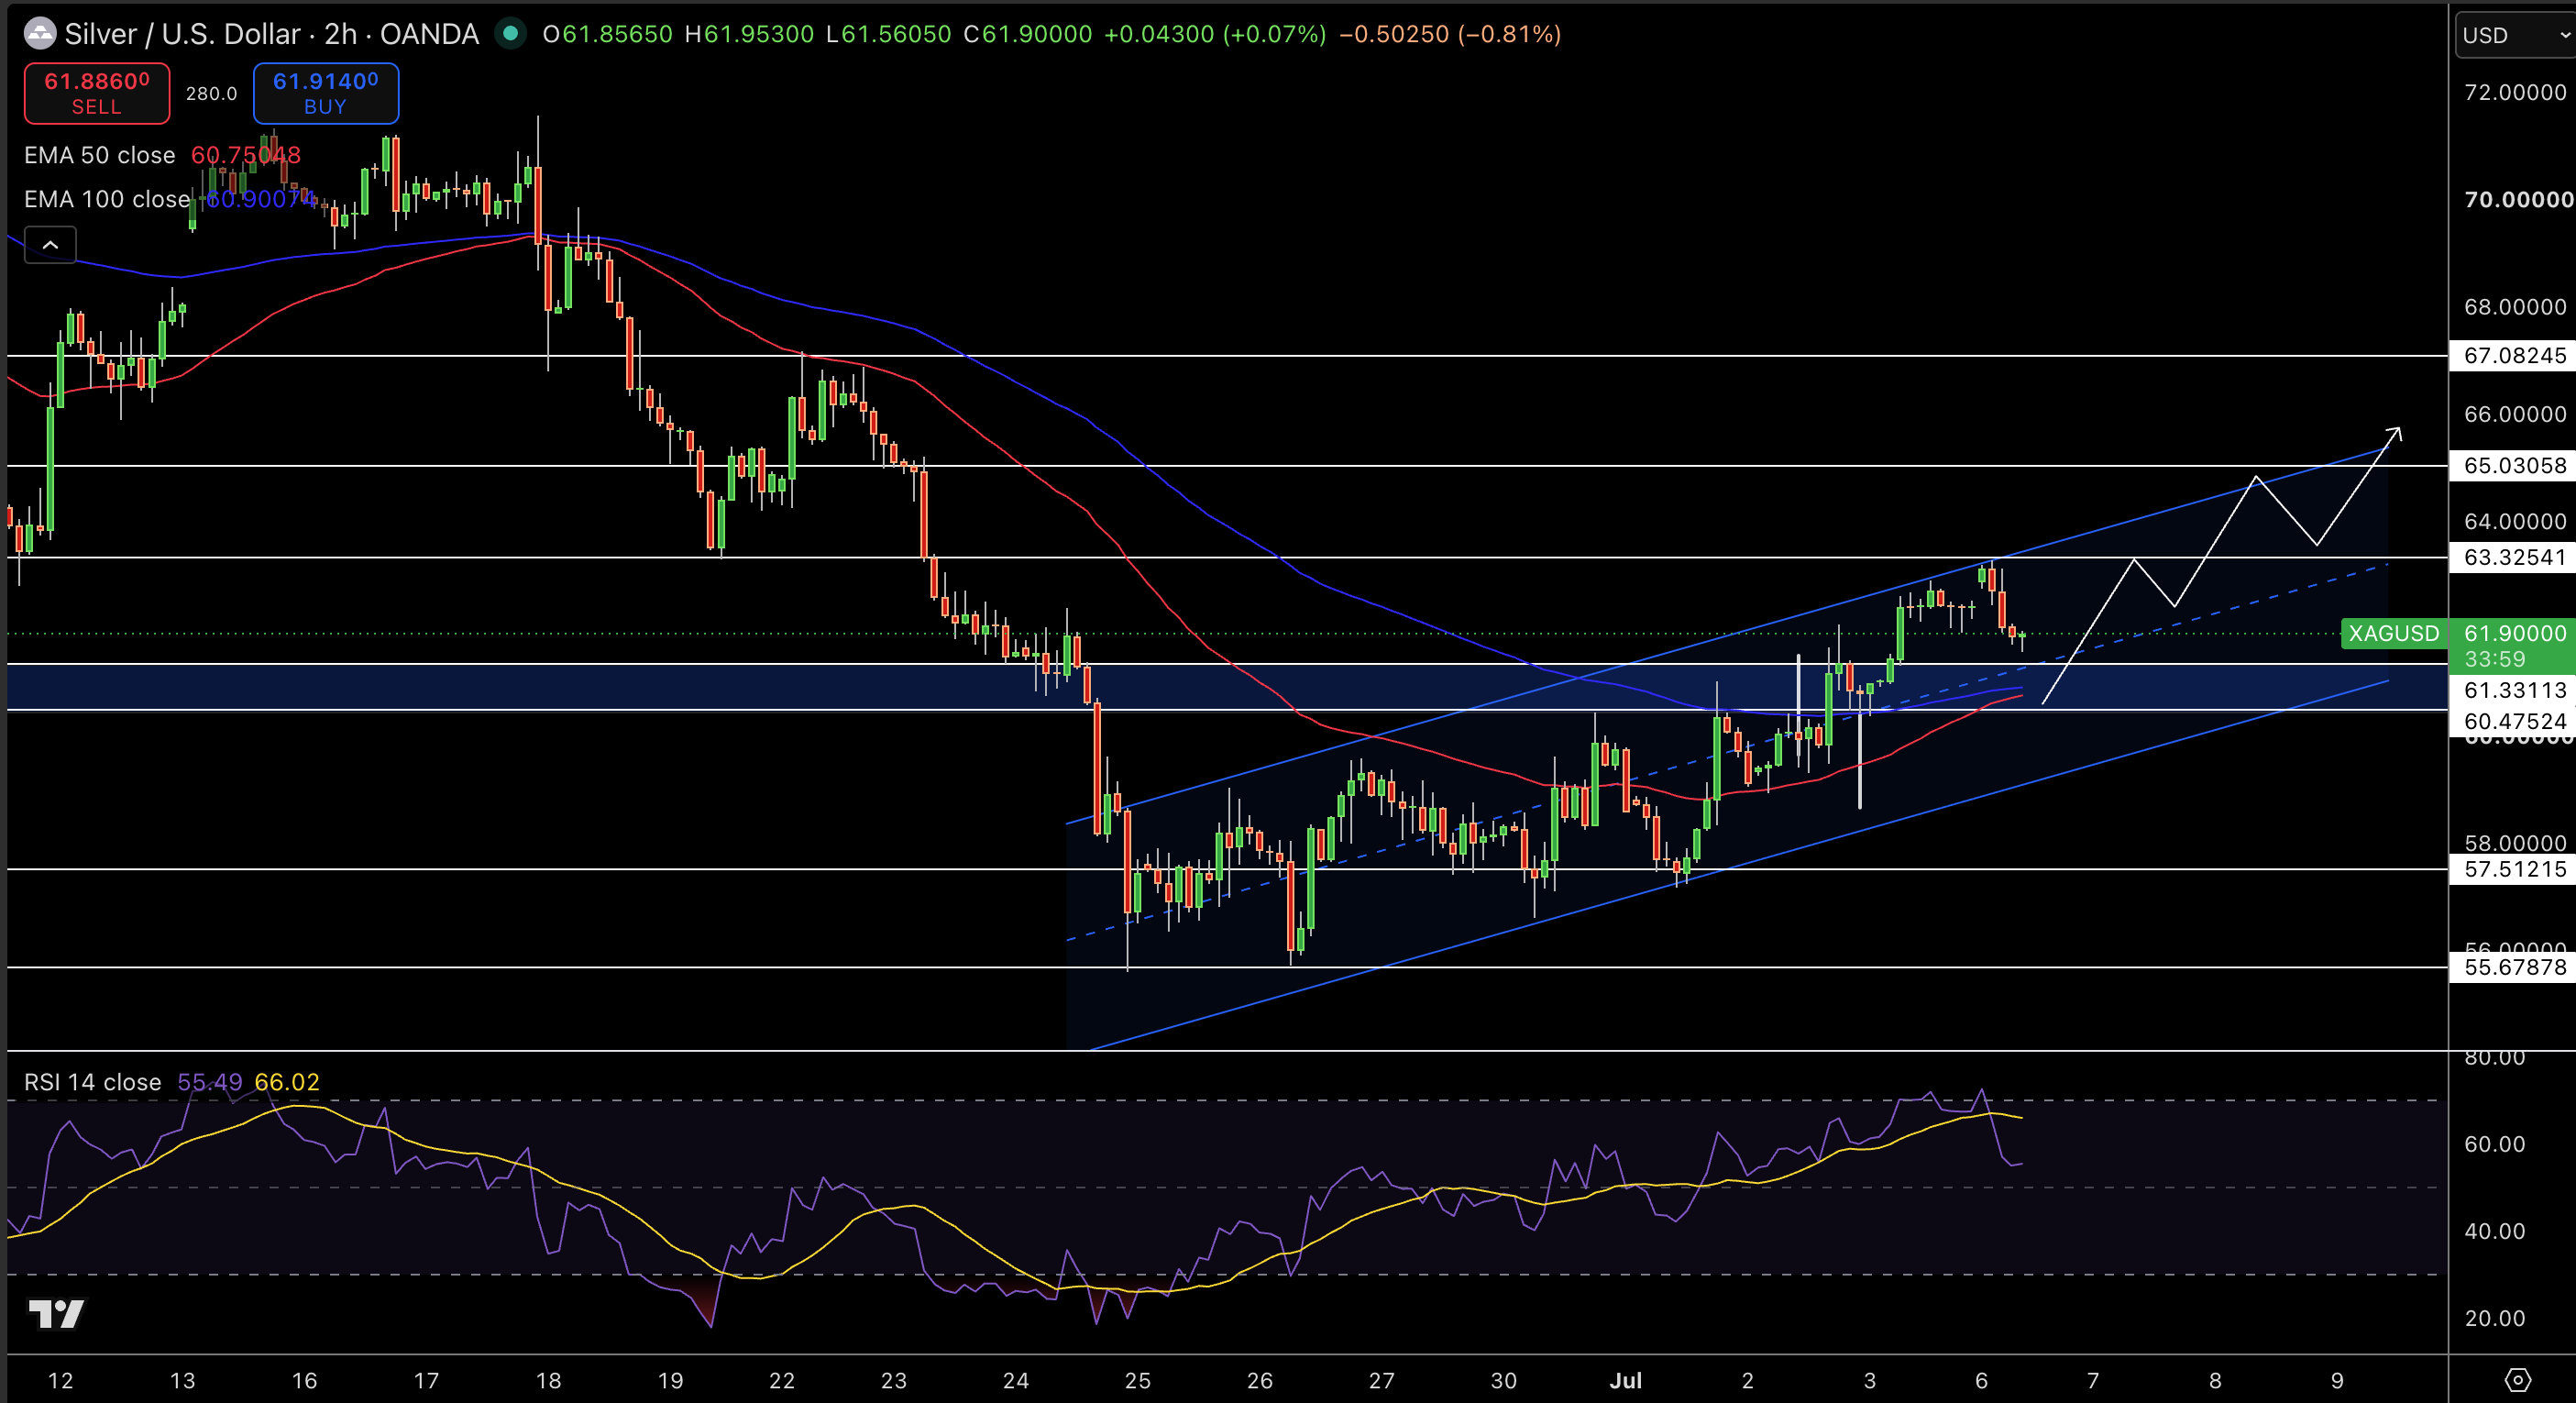
Silver Spot is priced at $61.90 on the 2h timeframe. It rebounded on a cluster of green candles, which held at the Blue 50 EMA near $60.75 after a sharp decline off the $67.66 high. Buyers defended the $57.12 lower lows level, evident by wicking rejection candlesticks.
RSI at 55 is neutral-bullish. There is a fair value buying zone between $60 and $62 based on the volume profile. A resistance level is identified between $62.43-63.32. The broad trend remains down, though bullish structure is confirmed with support at the Blue 50 EMA. Lower lows continue to show buying.
Trade Idea: Buy $61.90 with $62.43 target & $60.75 stop.


