



Oil and Gas Fundamentals Reflect Supply Discipline and Seasonal Demand
In recent oil market analysis from Friday, the global market is characterized by a delicate balance between OPEC+ compliance and growing non-OPEC production from the U.S. Other regions. Refinery runs remain strong as demand for transportation fuels and chemicals sustains. Stock changes in selected locations reflect a relatively balanced market.
The oil market in the U.S. this week showed little change in crude oil stocks. Operational inventories at major hubs were positioned near working minimum levels. Finished products demand remained robust.
Natural gas production in the U.S. continues to climb to new records as associated gas and direct-gas drilling increases. The market remains well supplied for LNG and domestic use. LNG exports continue to rise as U.S. facilities are well-utilized. Storage increases as the injection season progresses.
The inventory is positioned above historical averages. Electric power use is dependent on weather conditions. Industrial consumption provides a stable foundation. Overall, U.S. gas markets are well supplied to support both exports and domestic use.

Natural Gas Futures Rise to $3.232 – EMA 50 Defense on 2h
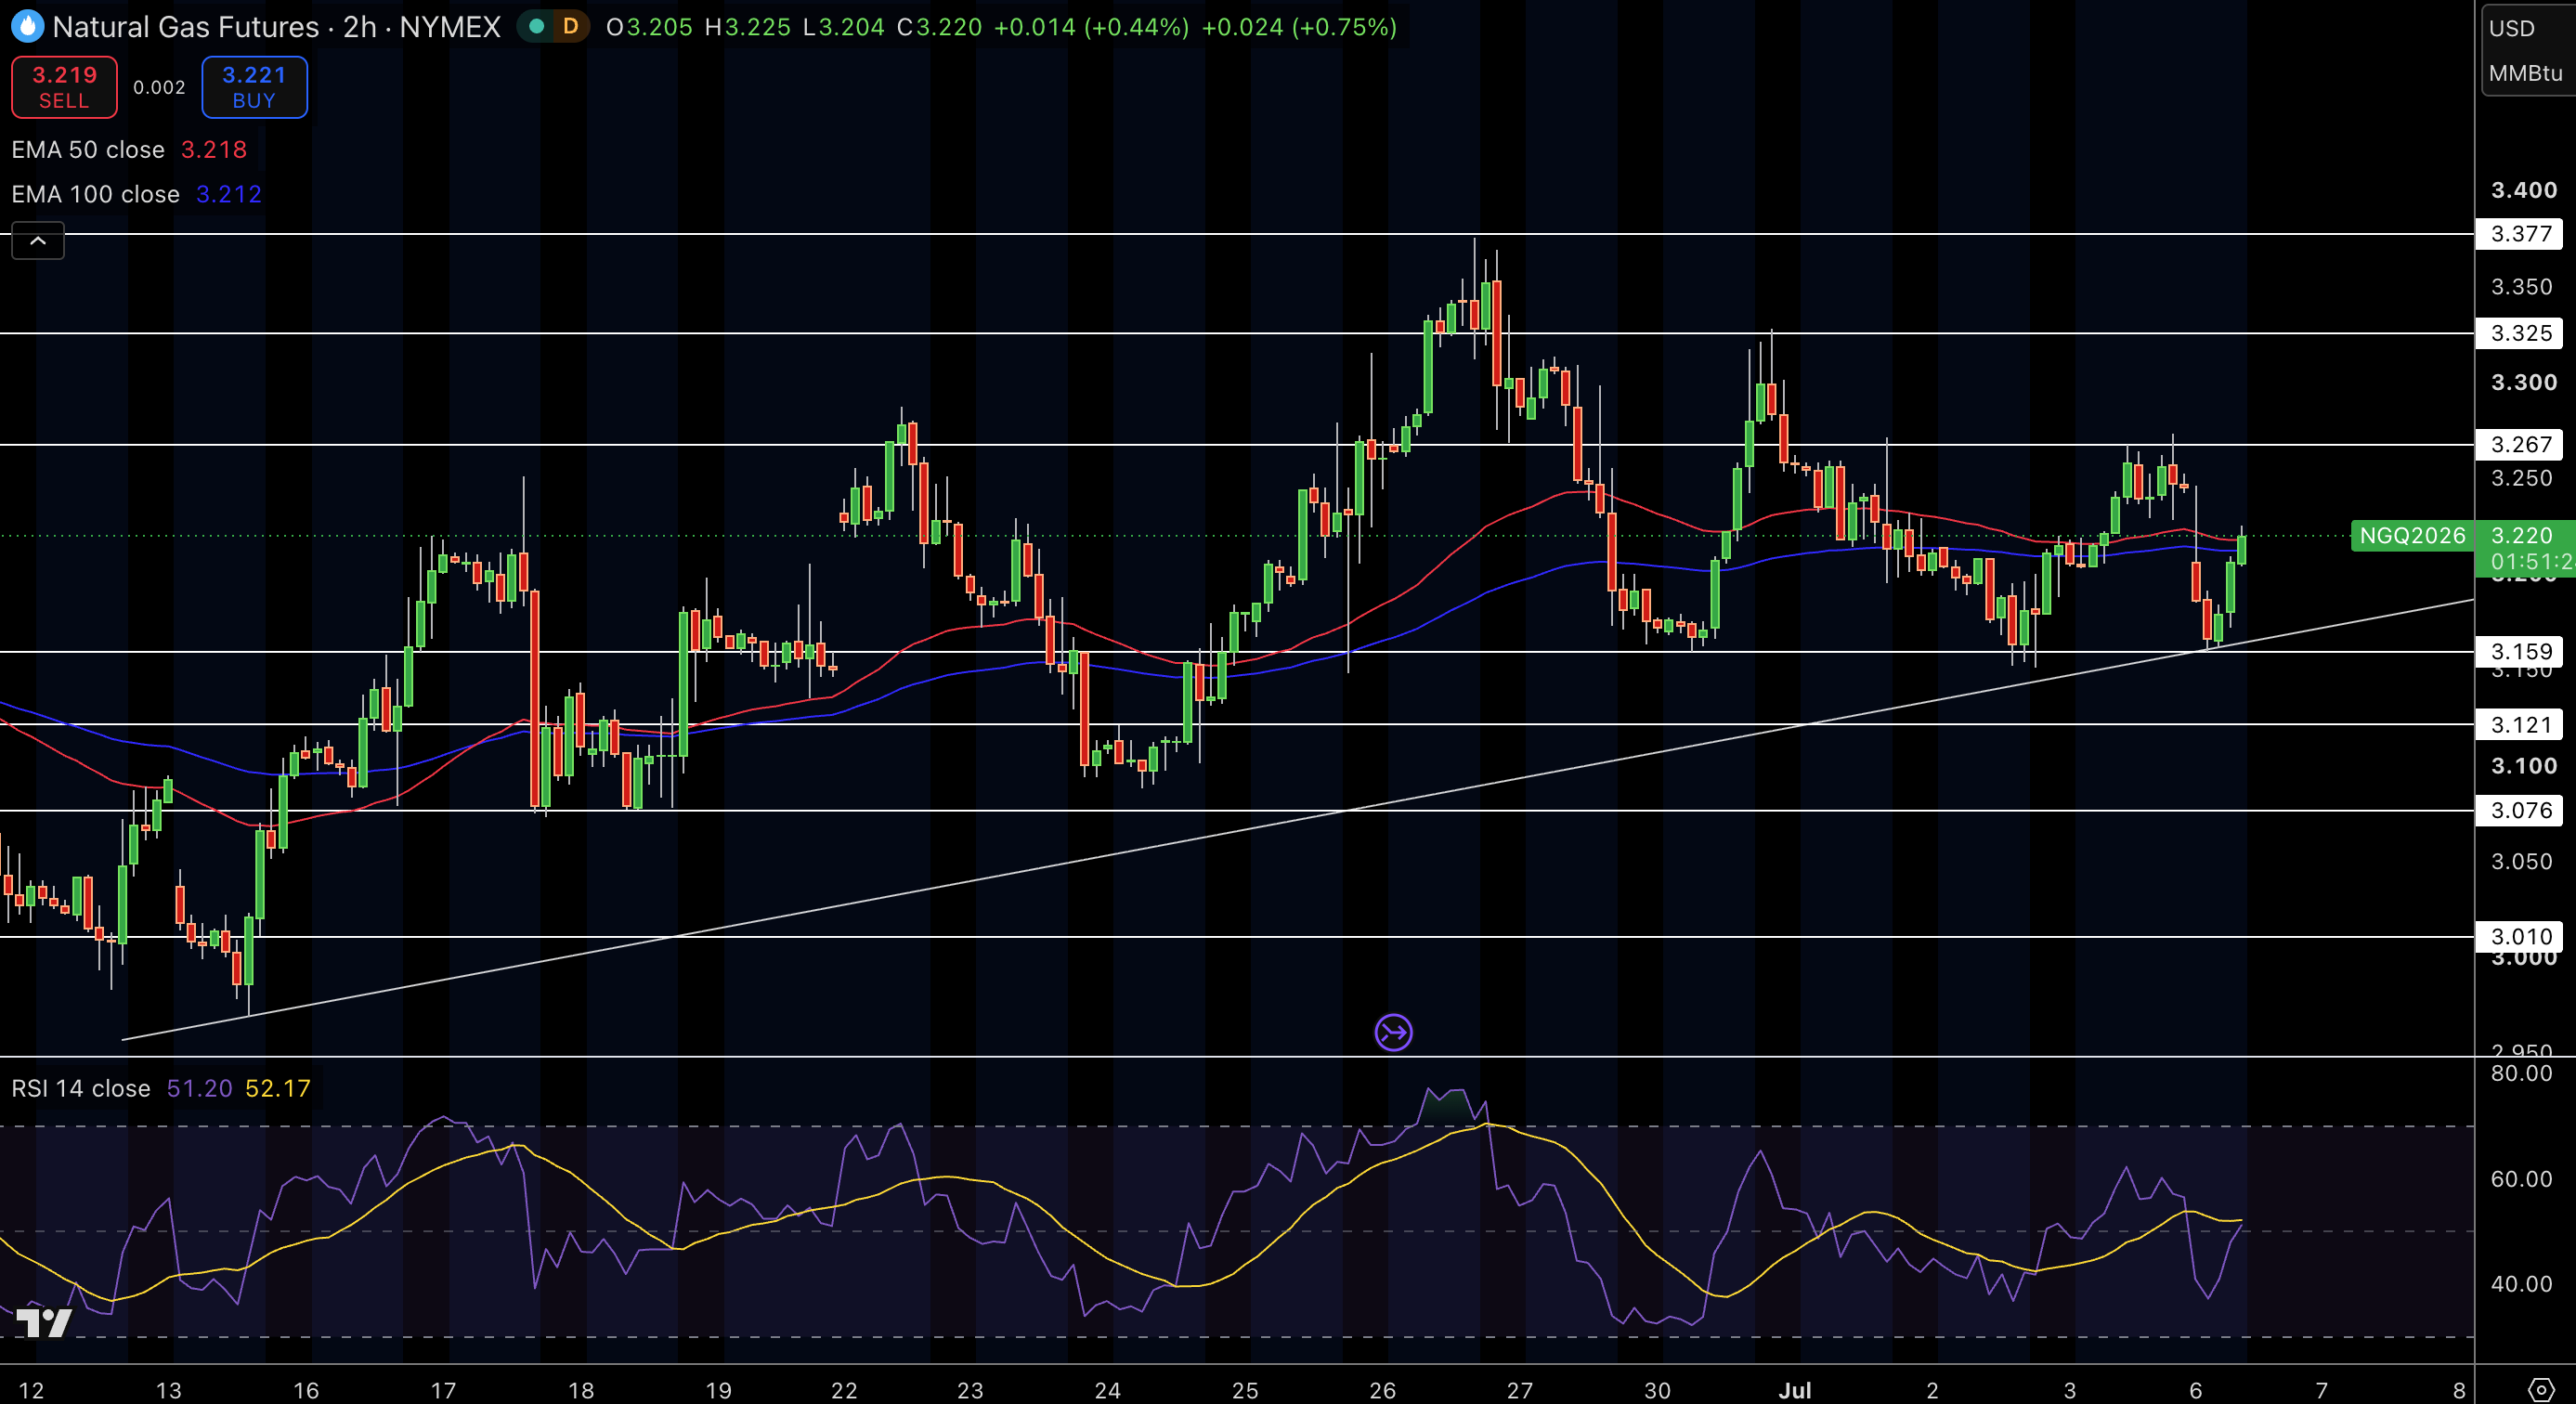
On a 2-hour NYMEX chart, Natural gas futures are changing hands at $3.232. The market is currently in a blue ascending channel, where the price bounced from the 50-period EMA at $3.218 to support the bulls. RSI is hovering around 51, suggesting the buyers have lost the momentum. In terms of volume profile, the $3.12 region represents an area of significant demand.
In terms of price levels, the price is looking to conquer $3.229-$3.260 resistance. The uptrend remains intact as price action is above the $3.099 swing low and following an orderly ascending channel. Higher highs and higher lows suggest that bulls will remain in the market during shallow corrections.
Trade Idea: Buy $3.232, targeting $3.260, with a stop at $3.12.
Natural Gas Price Forecast
Every new Natural Gas analysis as it publishes, today's technical signal and key levels, live price — on one page.
See all Natural Gas forecastsWTI Crude Oil Holds $69.09 – EMA 50 Defense on 2h
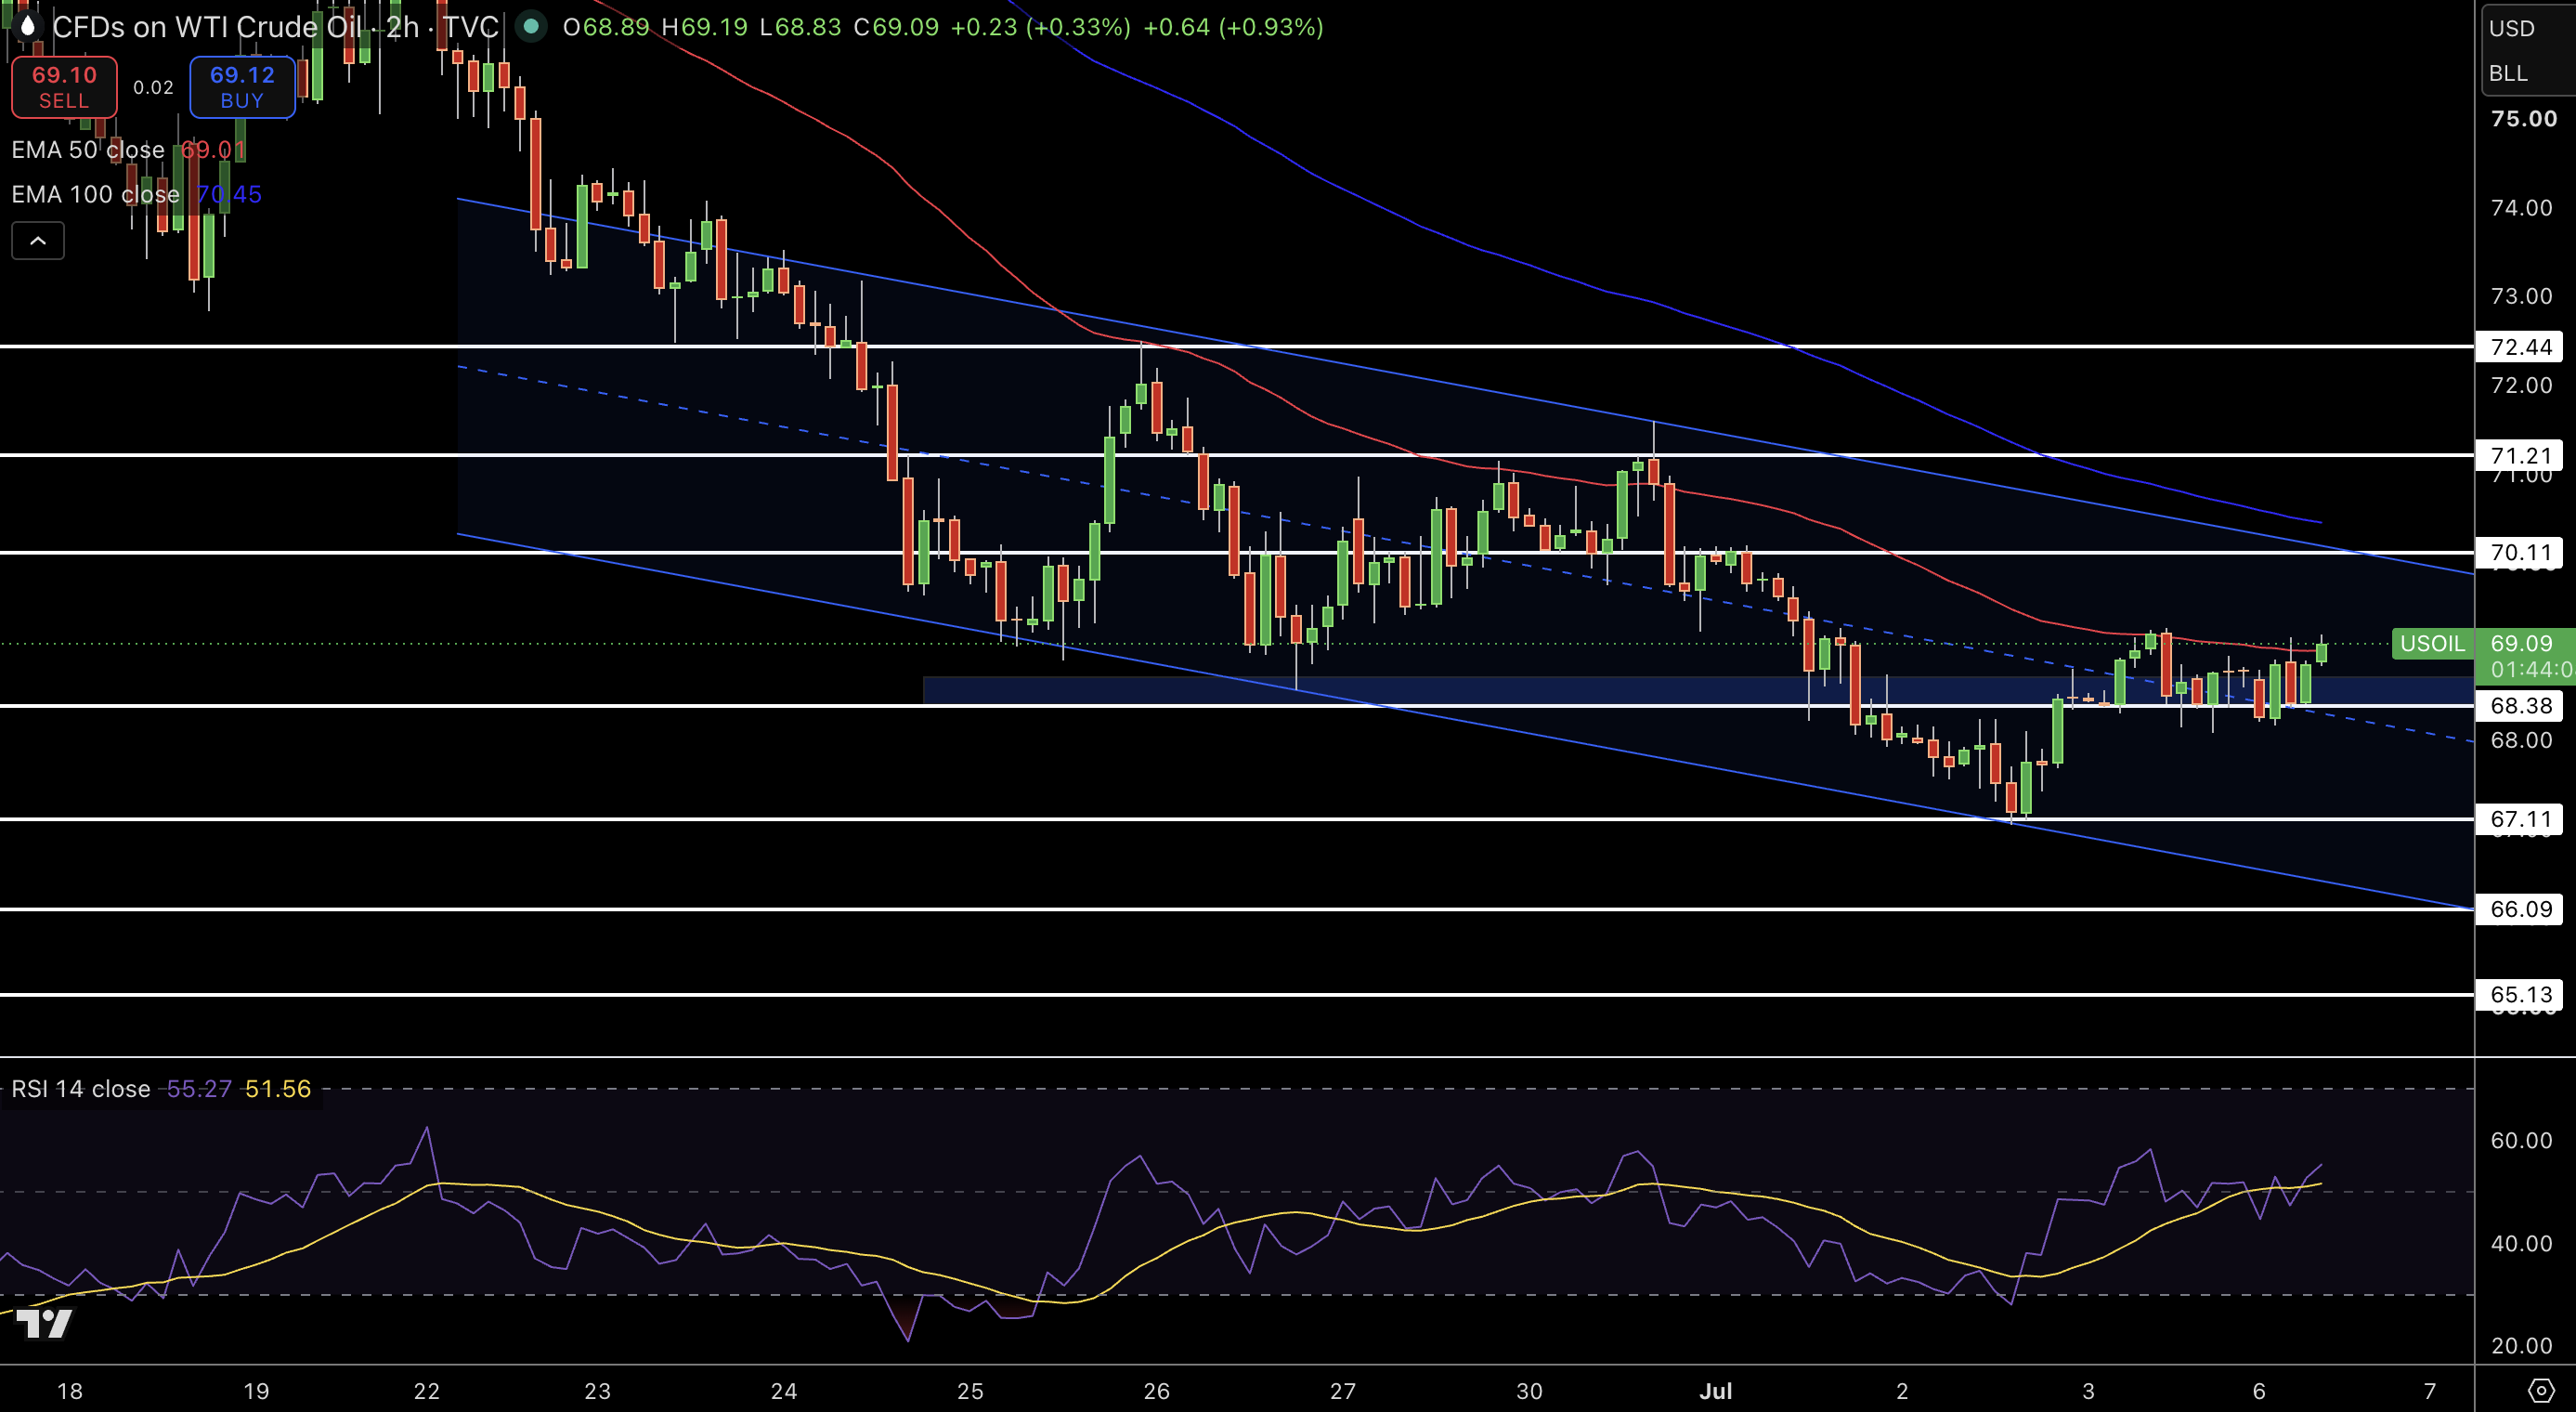
On the 2-hour chart, WTI is trading at $69.09. The 50-period EMA at $69.01 has seen green and red candles protect it after being rebuffed at the 100-period EMA ($70.45). Buyer absorption has occurred above support, as reflected in bullish rejection wicks and higher lows. RSI stands at roughly 55, implying a neutral-bullish stance. In terms of volume profile, $68.78-$70.11 represents a significant pivot zone.
The upcoming resistance comes in at $71.15-$72.44. The general trend is still downwards, yet the market’s bias leans neutral-to-bullish since the asset remains above the 50-period EMA and the sequence of higher lows continues to entice buyers.
Trade Idea: Buy $69.09, targeting $71.15, with a stop at $68.78.
Brent Crude Oil Holds $72.34 – Blue Descending Channel Floor on 2h
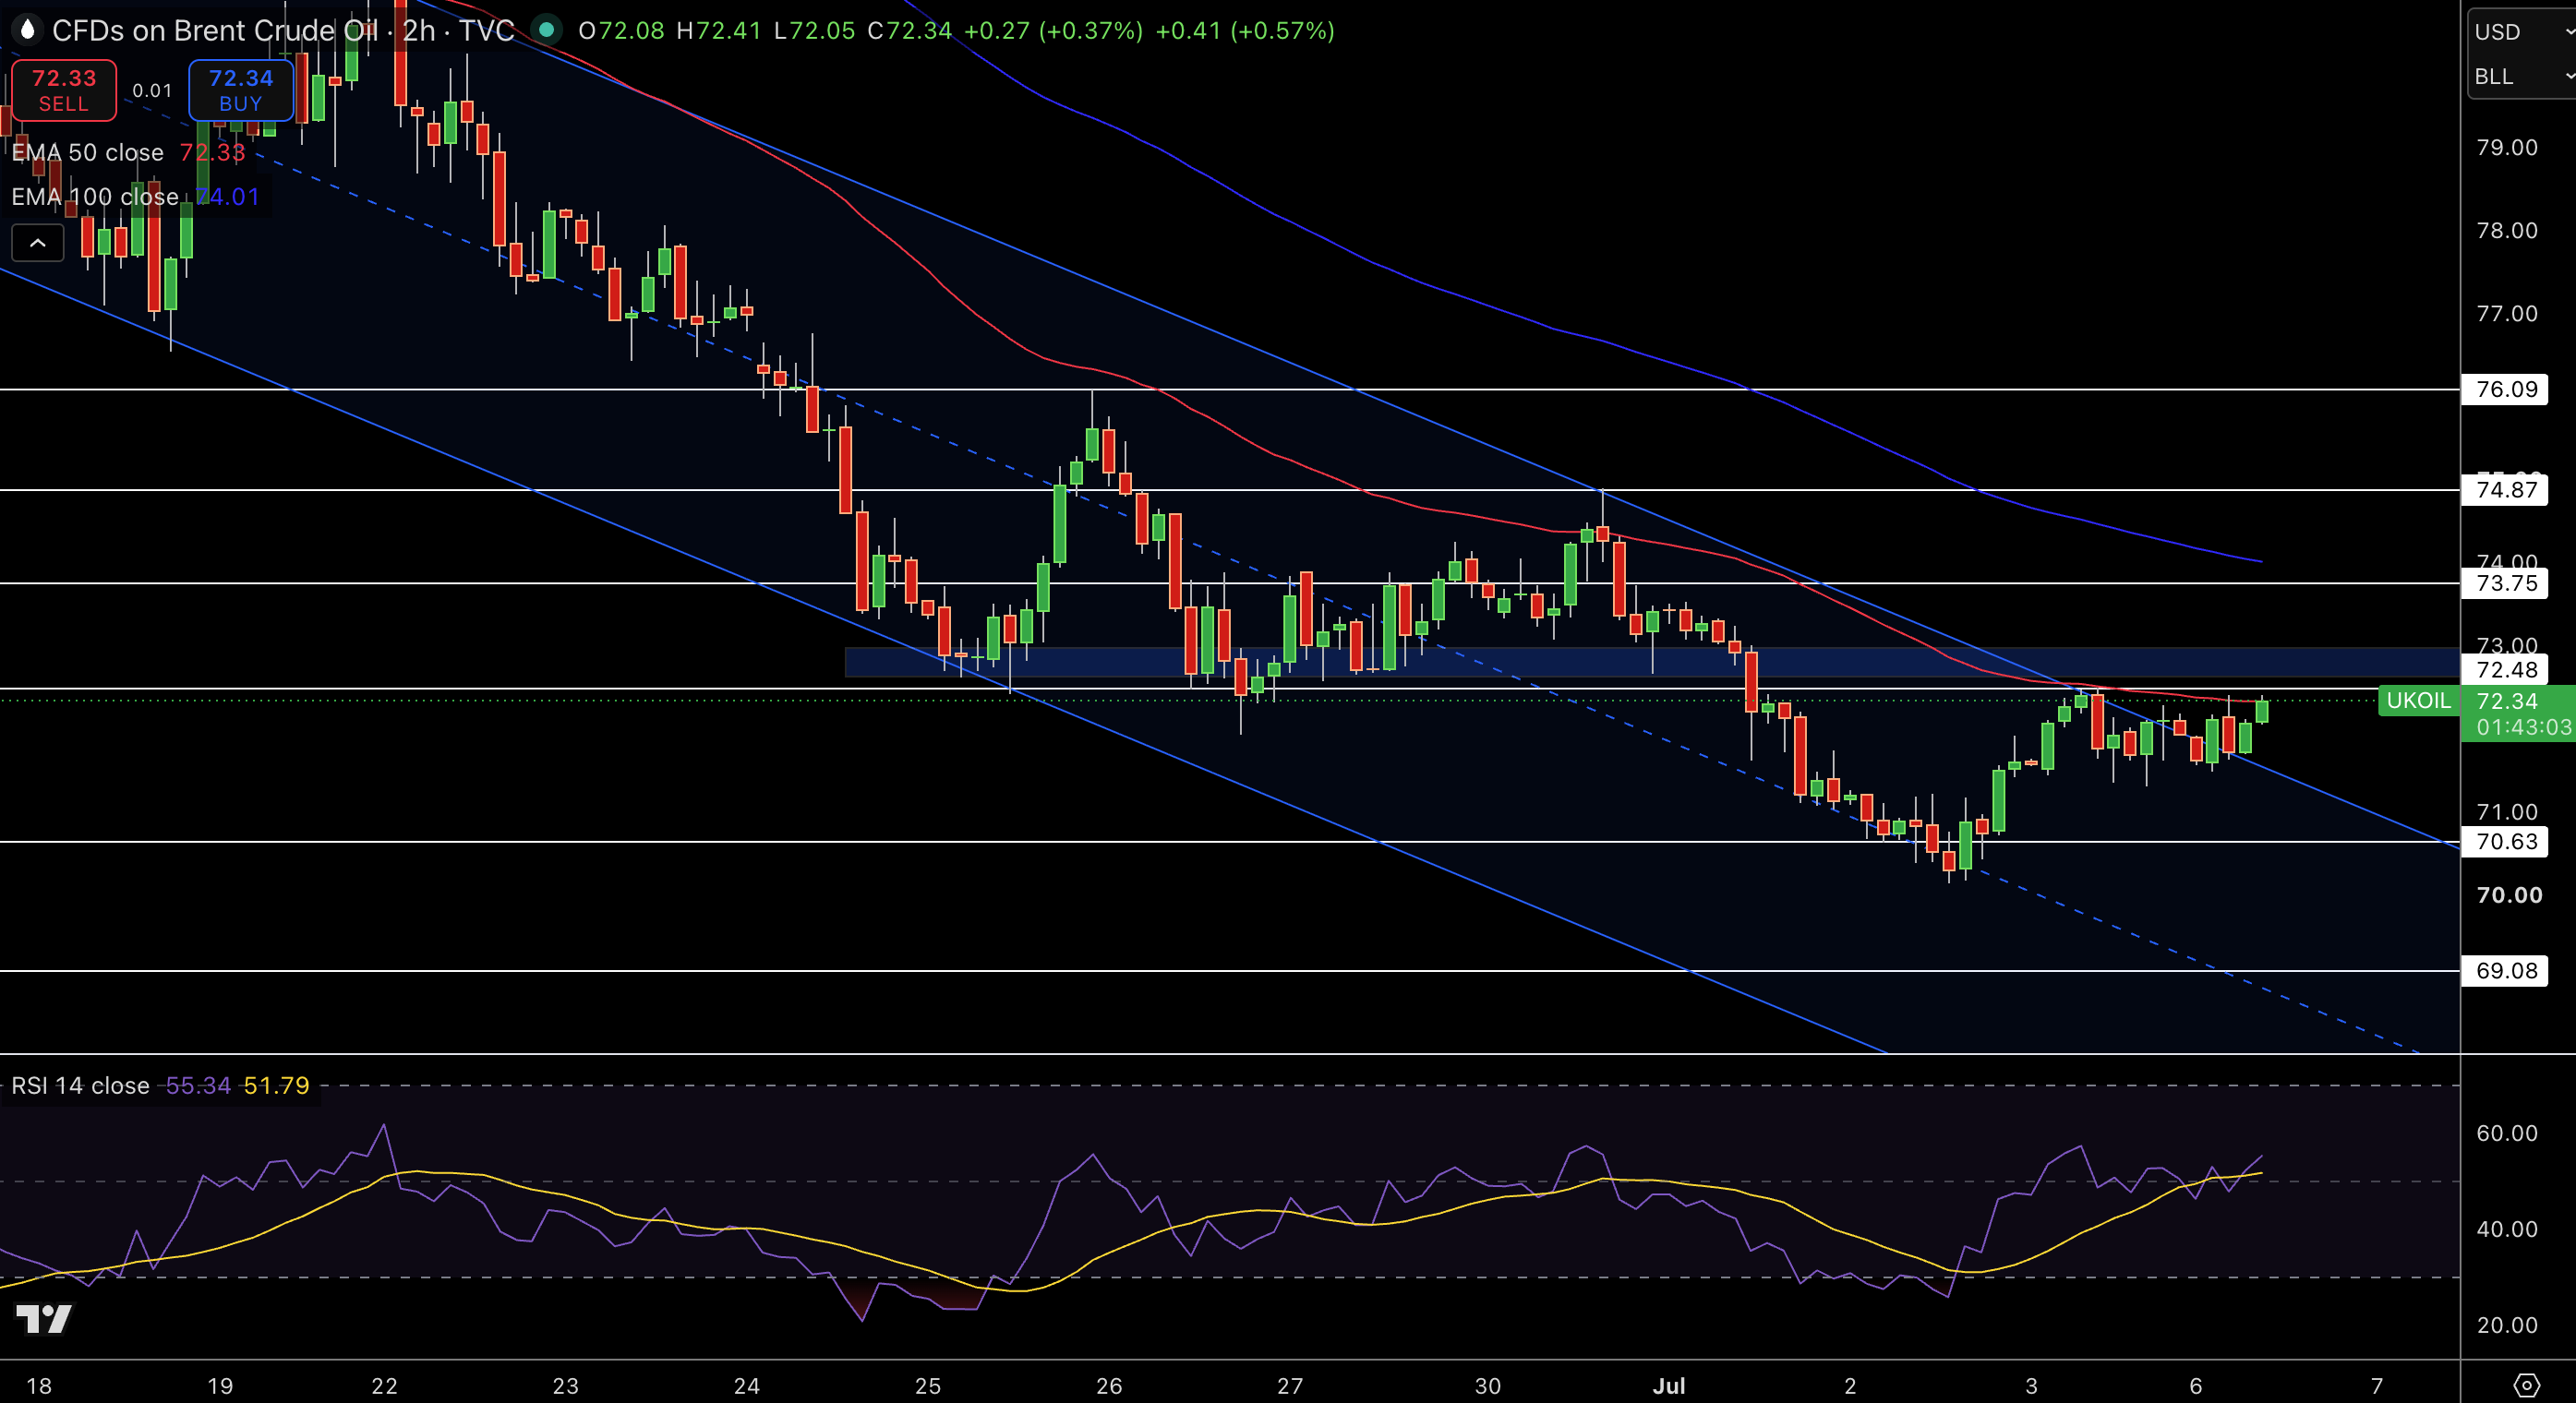
Trading at $72.34 on a 2-hour chart, Brent has probed the blue floor of its descending channel at $72.48 after a pullback from the red MA ($78.27). The limited follow-through to the downside as the candle has bounced off the blue floor indicates that buyers are stepping in above support to absorb selling interest.
RSI is around 50, pointing to a neutral market bias. The $73-$74 region now represents an area of potential fair value based on the volume profile. Price will need to conquer $74.49-$76.08 before advancing further. Price action is considered neutral-to-bullish on the 2-hour chart because the price is above the channel floor and the sequence of higher lows is sustaining buyer activity despite the prevailing downtrend.
Trade Idea: Buy $72.34, targeting $76.08, with a stop at $72.00.



