Gold (XAU) price rallied after the release of US jobs data, which reduced hopes of an imminent Fed rate hike. But the gold’s rebound does not eliminate the risk of further declines. Fed Chair Kevin Warsh emphasized that the Fed may not tolerate inflation above the target. This implies that rate increases may be in the cards later this year despite the weak jobs report.
Investors will now be paying close attention to ISM services PMI and the Fed minutes for any additional clues. Treasury yields and the U.S. dollar could be back on the rise if services inflation stays elevated and the Fed minutes are hawkish.
Silver (XAG) also edged up with gold as investors responded to easing rate hike prospects and weaker dollar. The precious metals demand remains strong but it also depends on the signals of economic growth.
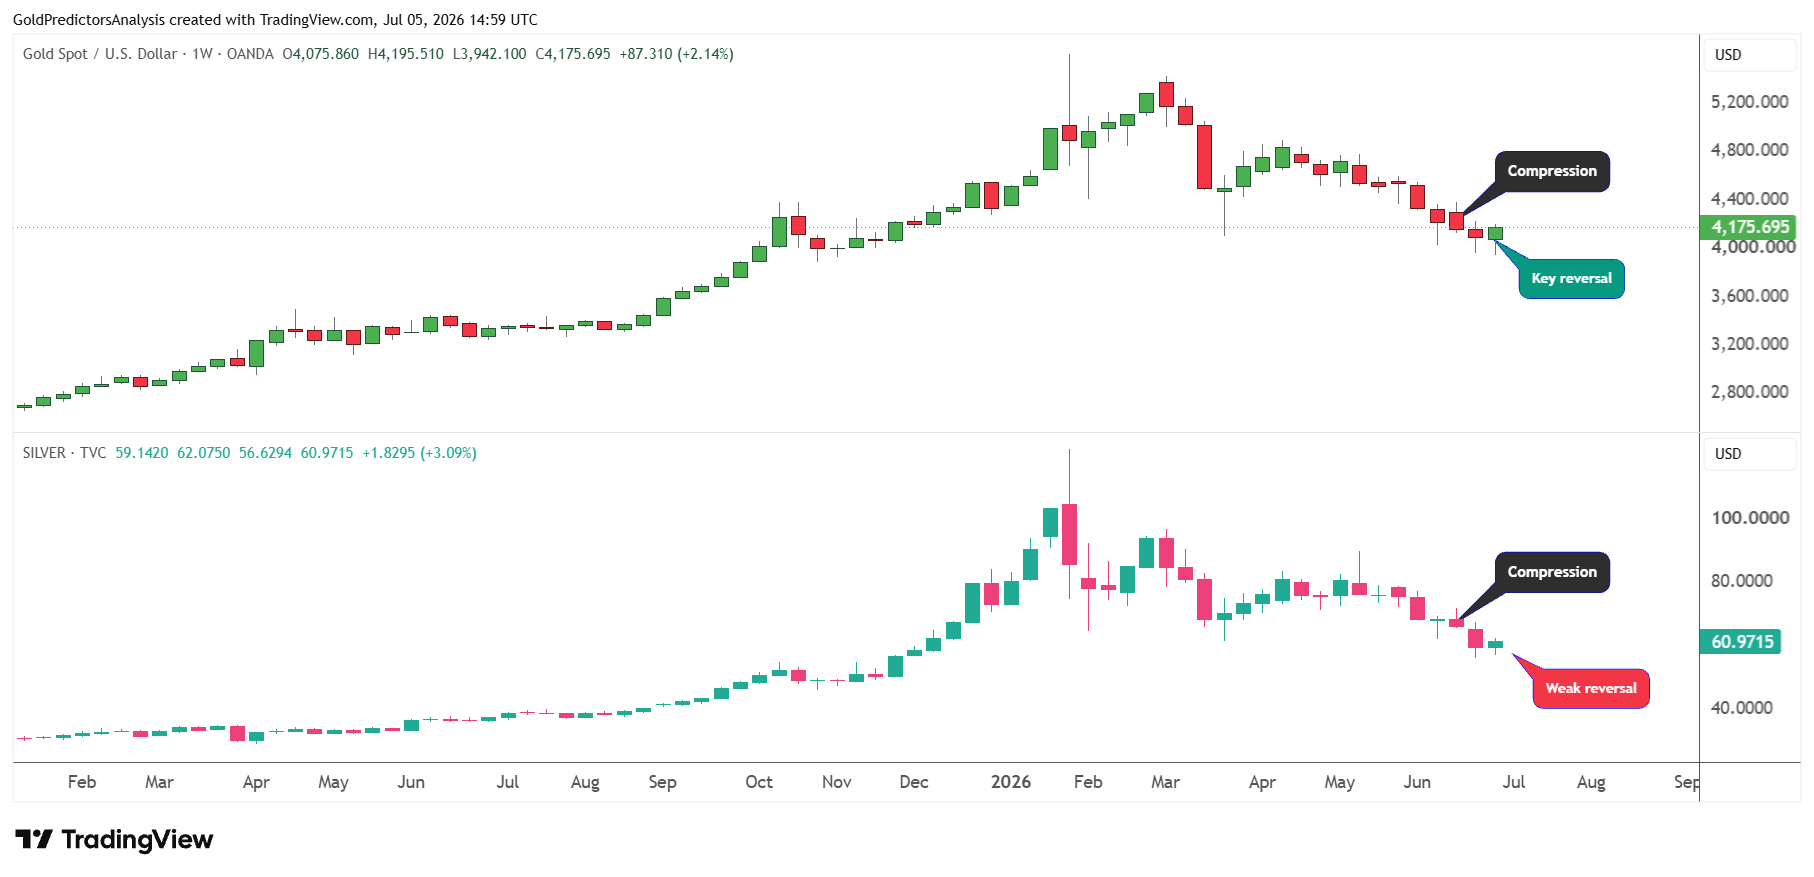
If weak jobs data fuels concerns of the economic slowdown, silver could struggle as it is also exposed to industrial demand. The chart below shows that the gold price produced a bullish hammer candle last week after the weak jobs data but the rebound in silver was limited.

Gold Price Forecast: $4,260 Breakout Could Target $4,500
XAUUSD Daily Chart: Gold Rebounds from $3,950 Support
The daily chart for spot gold shows that the price is rebounding from the strong support zone of $3,900-$4,000. This support zone is defined by the support of the ascending broadening wedge pattern which was broken in May 2026 at $4,500.
The price is rebounding back towards the 50 and 200 SMAs in the $4,400 to $4,500 region. But there is immediate resistance at $4,260, which is defined by the descending trend line coming from the March 2, 2026, highs.
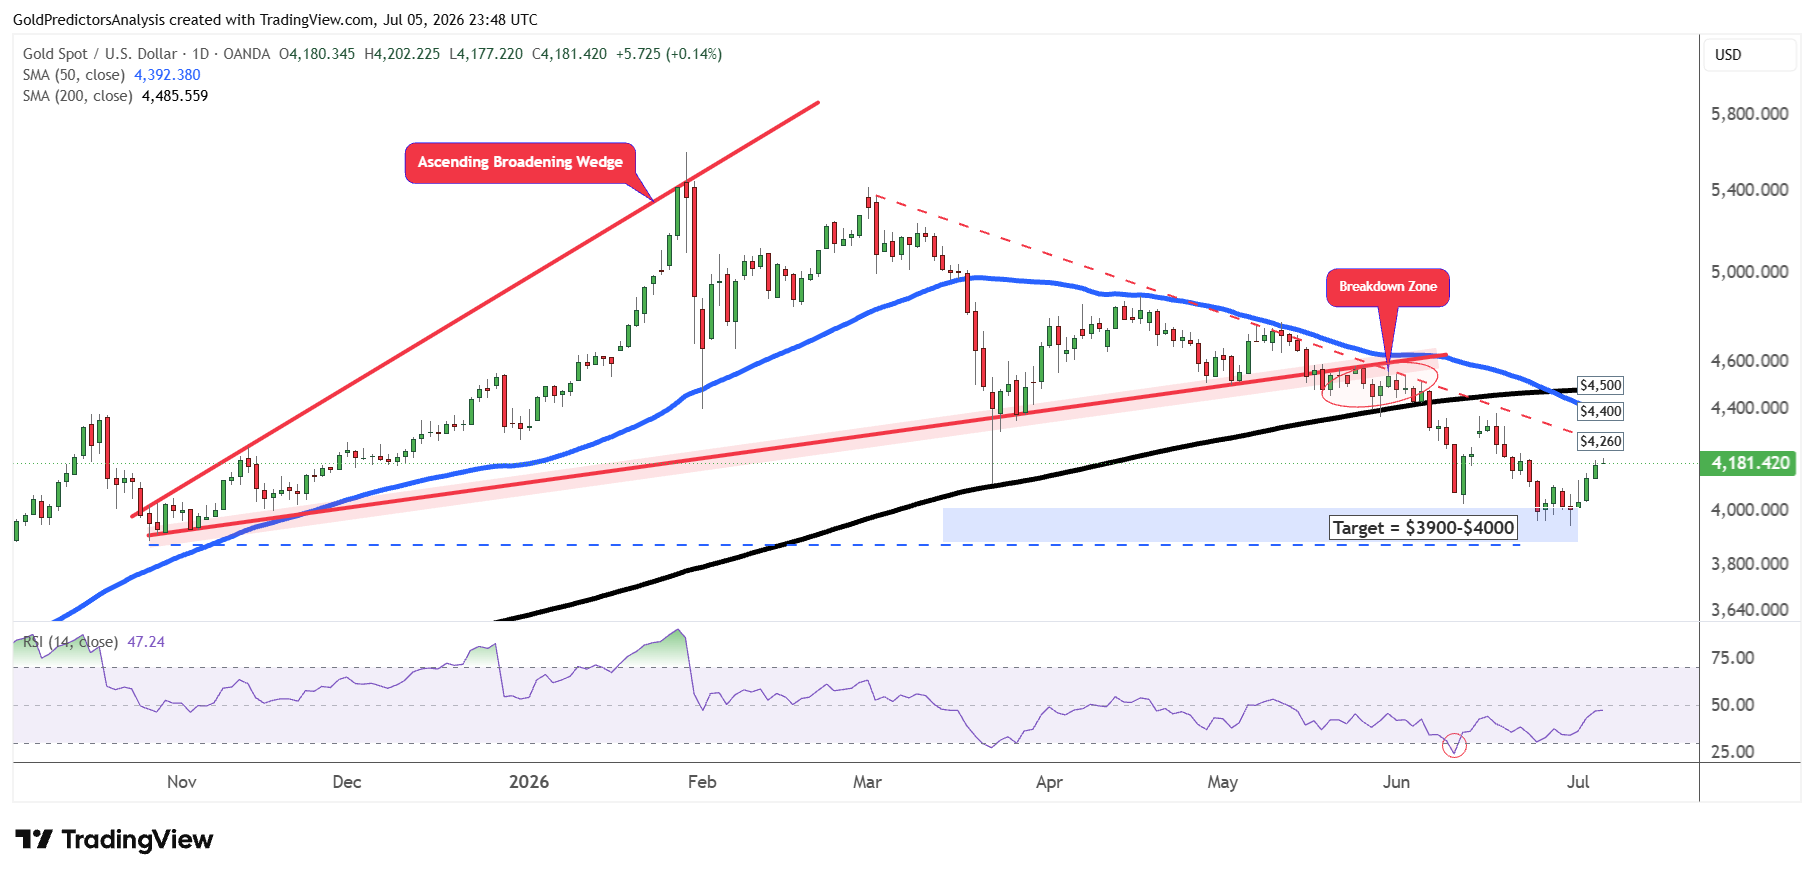
A break above $4,260 will trigger a move towards the $4,400 range. However, a break above $4,400 will push the price towards $4,500, which is the 200-day SMA. A break above the 200-day SMA will indicate that the gold market is recovering from the lows and point to further upside towards the $5,000 area.
The RSI indicator shows that rebound from current levels is needed to keep the gold market healthy. But a break below $3,900 will invalidate the short-term support and trigger a strong move towards $3,800.
Gold Price Forecast
Every new Gold analysis as it publishes, today's technical signal and key levels, live price — on one page.
See all Gold forecastsXAUUSD 4-Hour: Gold Tests Short-Term Resistance
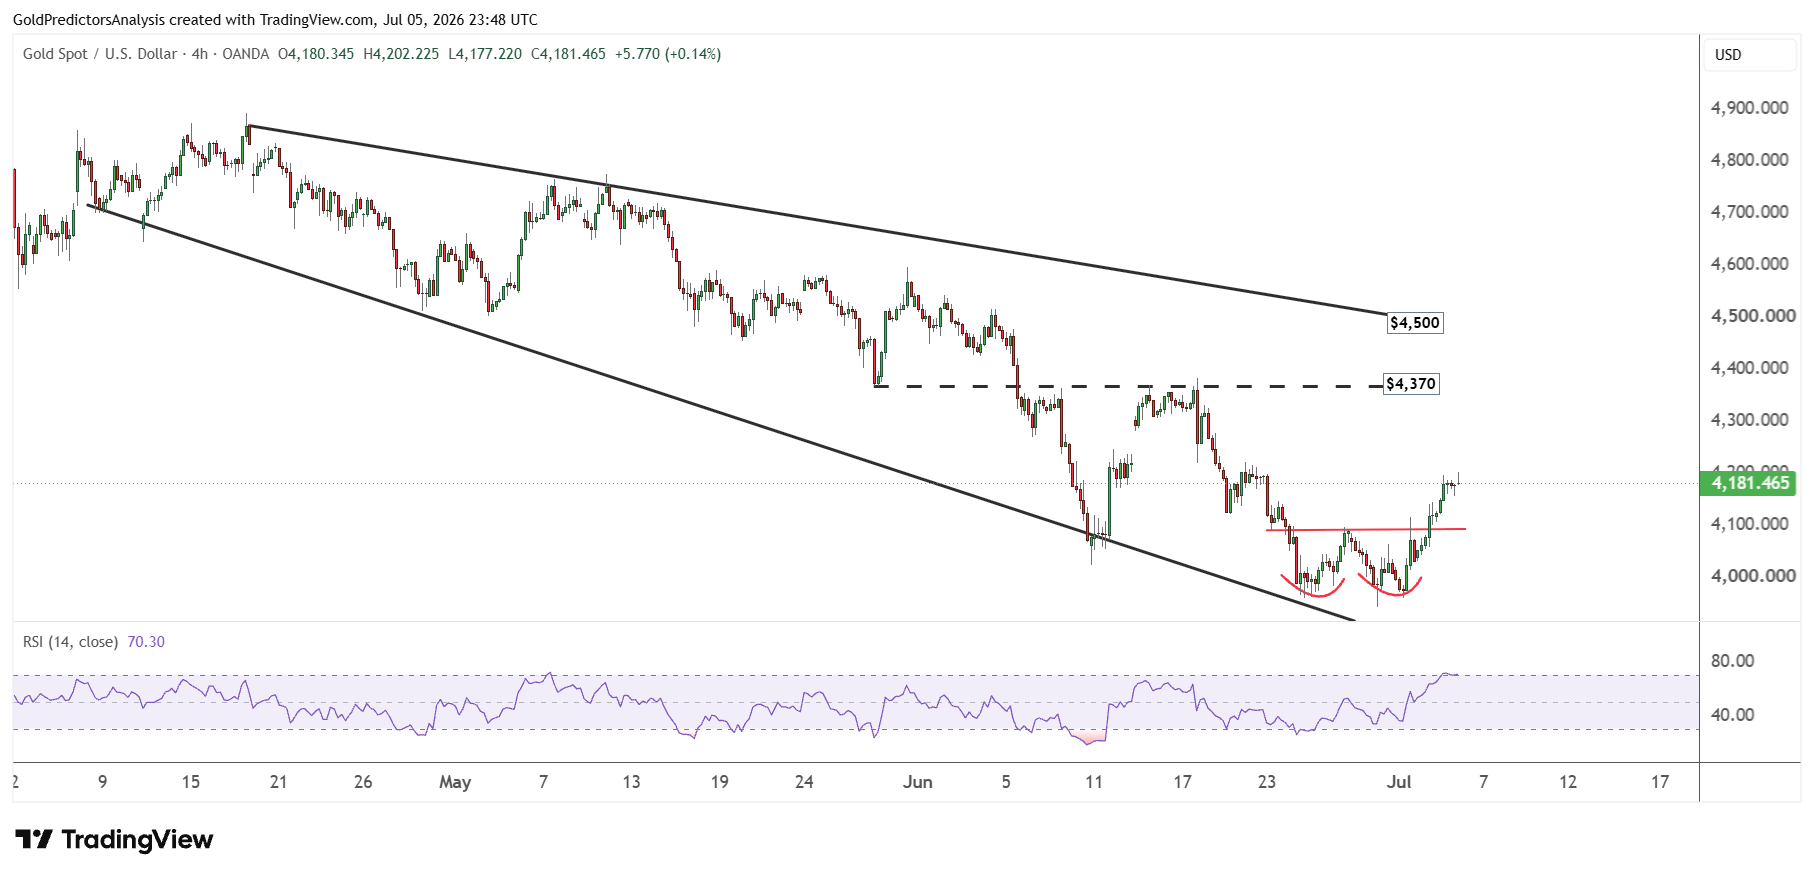
The 4-hour chart for spot gold shows that the price has found strong support at $3,950. The price is now pushing towards $4,260 as the immediate resistance. A break above this level will push gold towards $4,370.
The price is looking for the resistance of the descending trend line. This resistance is also defined as the 200-day SMA on daily chart. Therefore, $4,500 remains the pivotal area to open the door for a strong rally in the gold market.
Silver Price Forecast: $64 Breakout Opens Path to $72
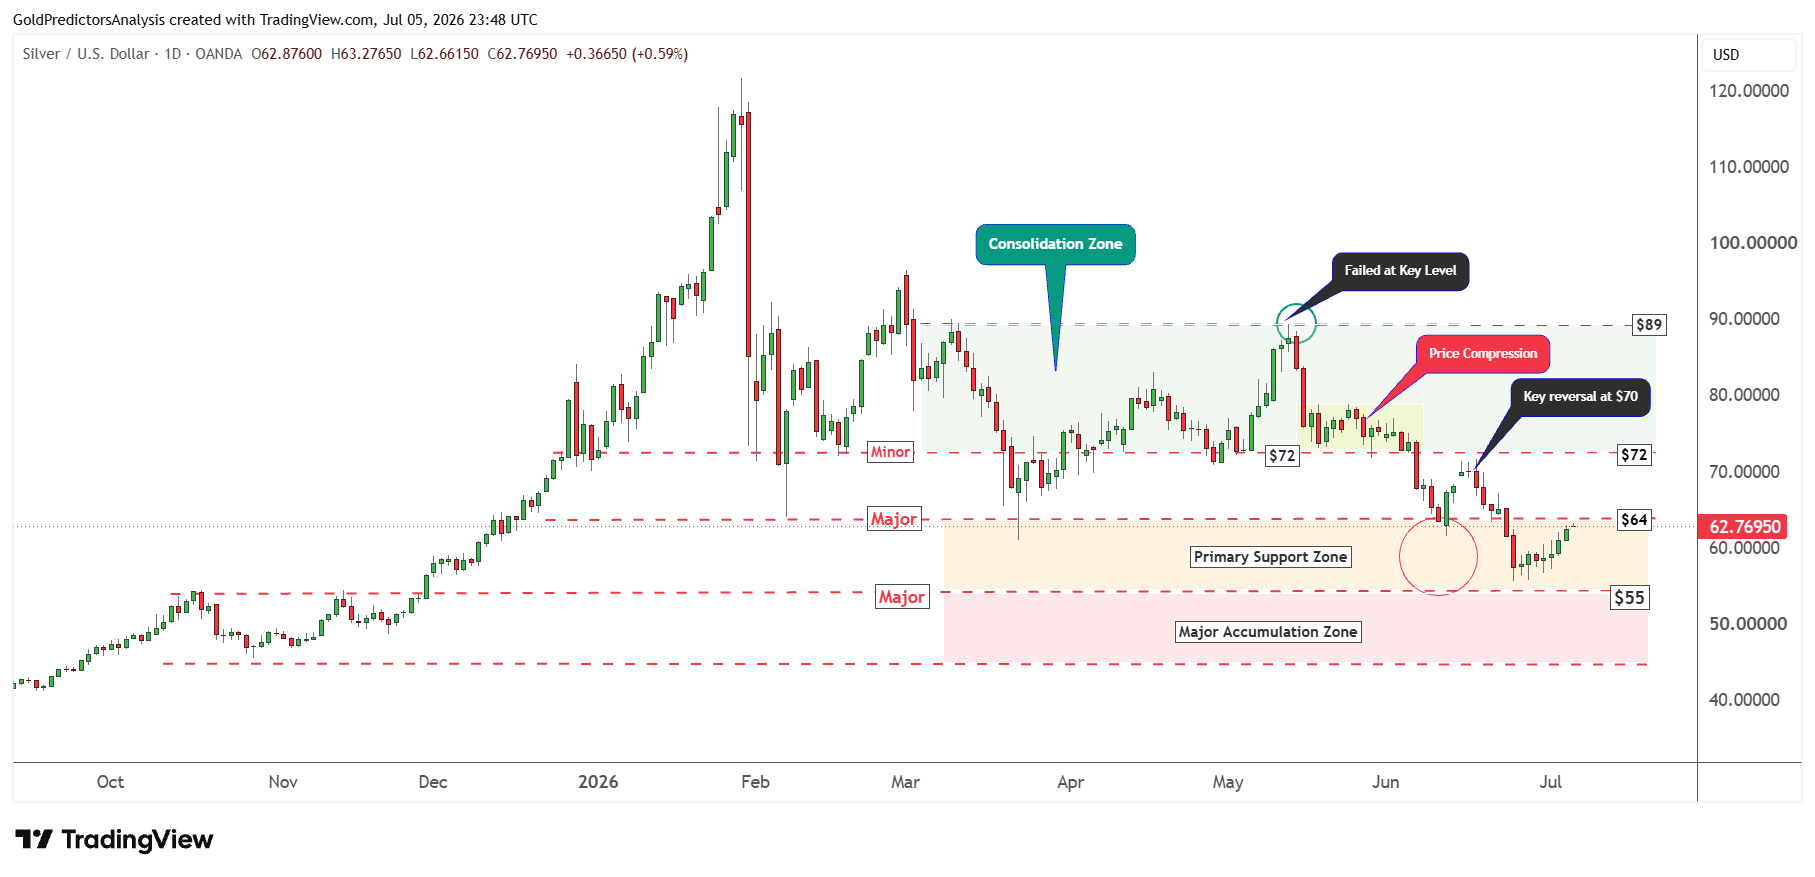
XAGUSD Daily: Silver Rebounds from $55 Support
The daily chart for spot silver shows that the price has found strong support at lower boundary of the primary support zone at $55. The price is now rebounding towards the resistance of $64. A break above $64 will push the price towards $72.
But a failure to break above $64 will indicate another drop towards $55. As long as the price remains above the major accumulation zone between $45 and $55, the overall picture for the silver market remains strongly bullish.
The silver price must break the key level of $72 to trigger a move towards $90 and possibly higher.
XAGUSD 4-Hour Chart: Silver Rebound Needs Confirmation
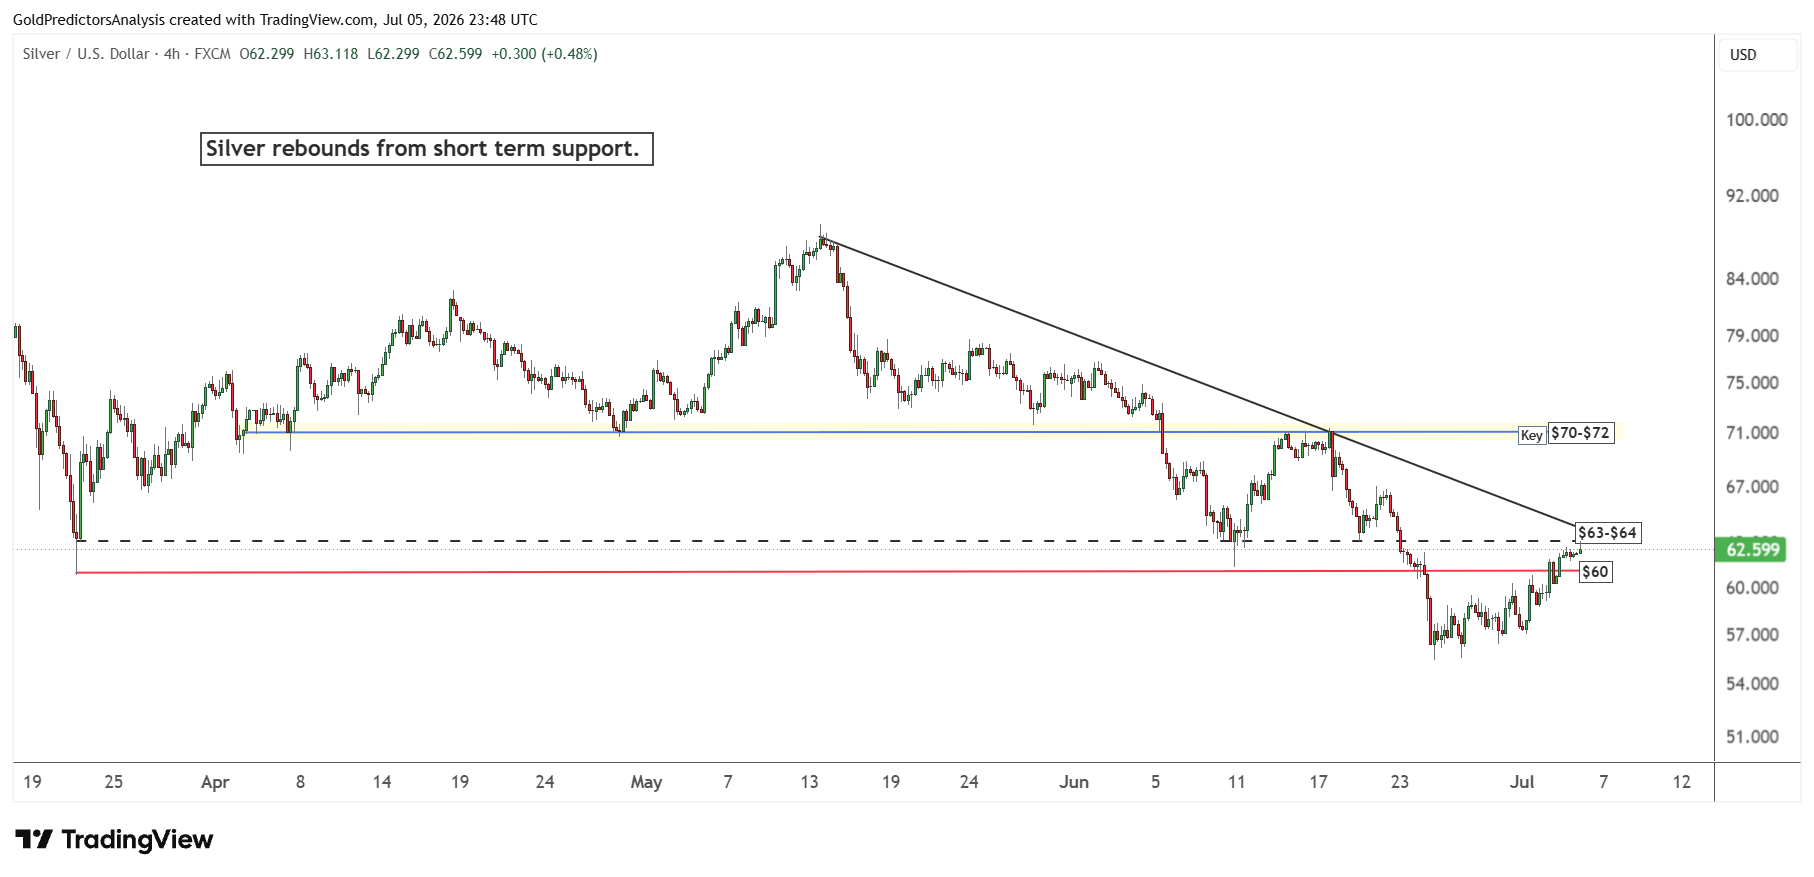
The 4-hour chart for spot silver also shows a strong rebound towards the resistance of $64, which is defined by the descending trend line stemming from the August 13, 2026 highs.
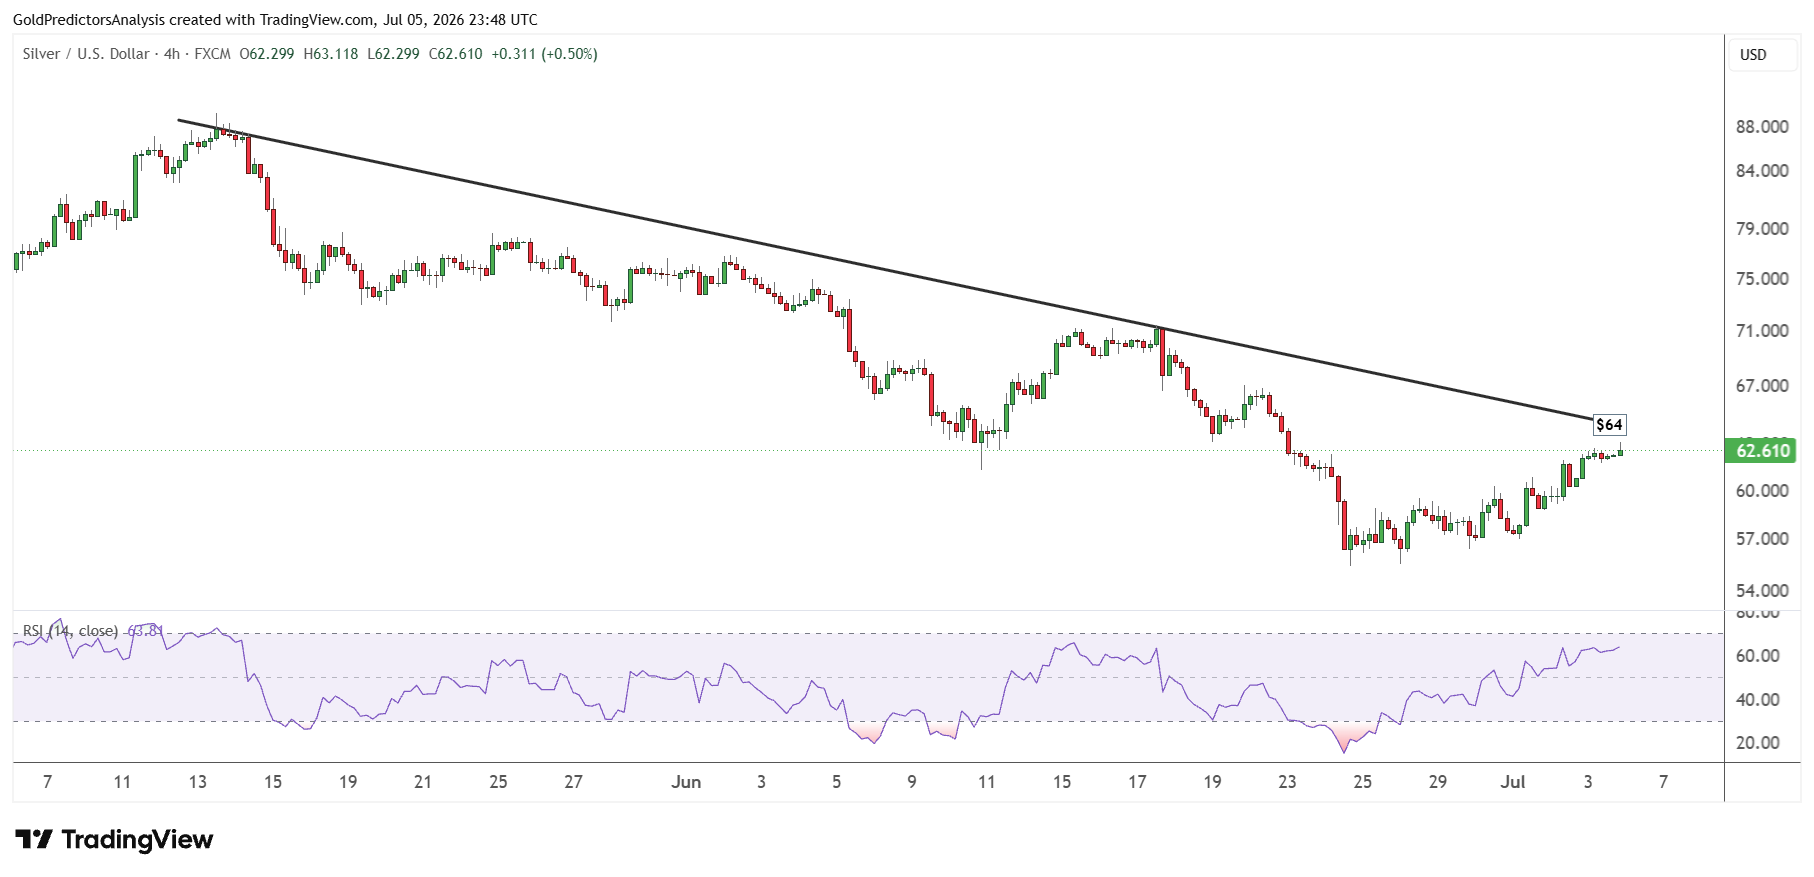
However, the rebound so far is very limited. The recent rebound in silver is due to the extremely oversold conditions on the 4-hour chart. The price may drop further if it fails to break the 64 level.
On the other hand, a break above $64 will likely push the price towards the $72 area which is the key level in the silver market. The silver price must break $72 to confirm a bottom and initiate a strong rally.
Bottom Line
Gold and silver prices have rallied following weak U.S. jobs data that reduced the likelihood of a near term Fed interest rate hike. But the ISM services PMI and the Fed minutes this week need to be watched this week for further clues. Gold needs to break above $4,260 to continue its recovery towards $4,400 and $4,500. On the other hand, a break below $3,900 will indicate further downside.
The spot silver price needs to break above $64 to gain momentum towards $72. If the price fails to break $64, it may drop back to $55. Precious metals could be at risk if the Fed tone is hawkish. But if the rate hike expectations fade, gold and silver could extend the rebound.