



Risk Premium Keeps Coming Out of Crude
WTI and Brent posted another losing week. Strait of Hormuz shipping keeps improving, OPEC+ approved another production increase for August, and Goldman Sachs and J.P. Morgan both cut their price outlooks. The supply disruption fear that built all spring is coming apart and crude has not found a floor.

Weekly August WTI Crude Oil Futures Technical Analysis
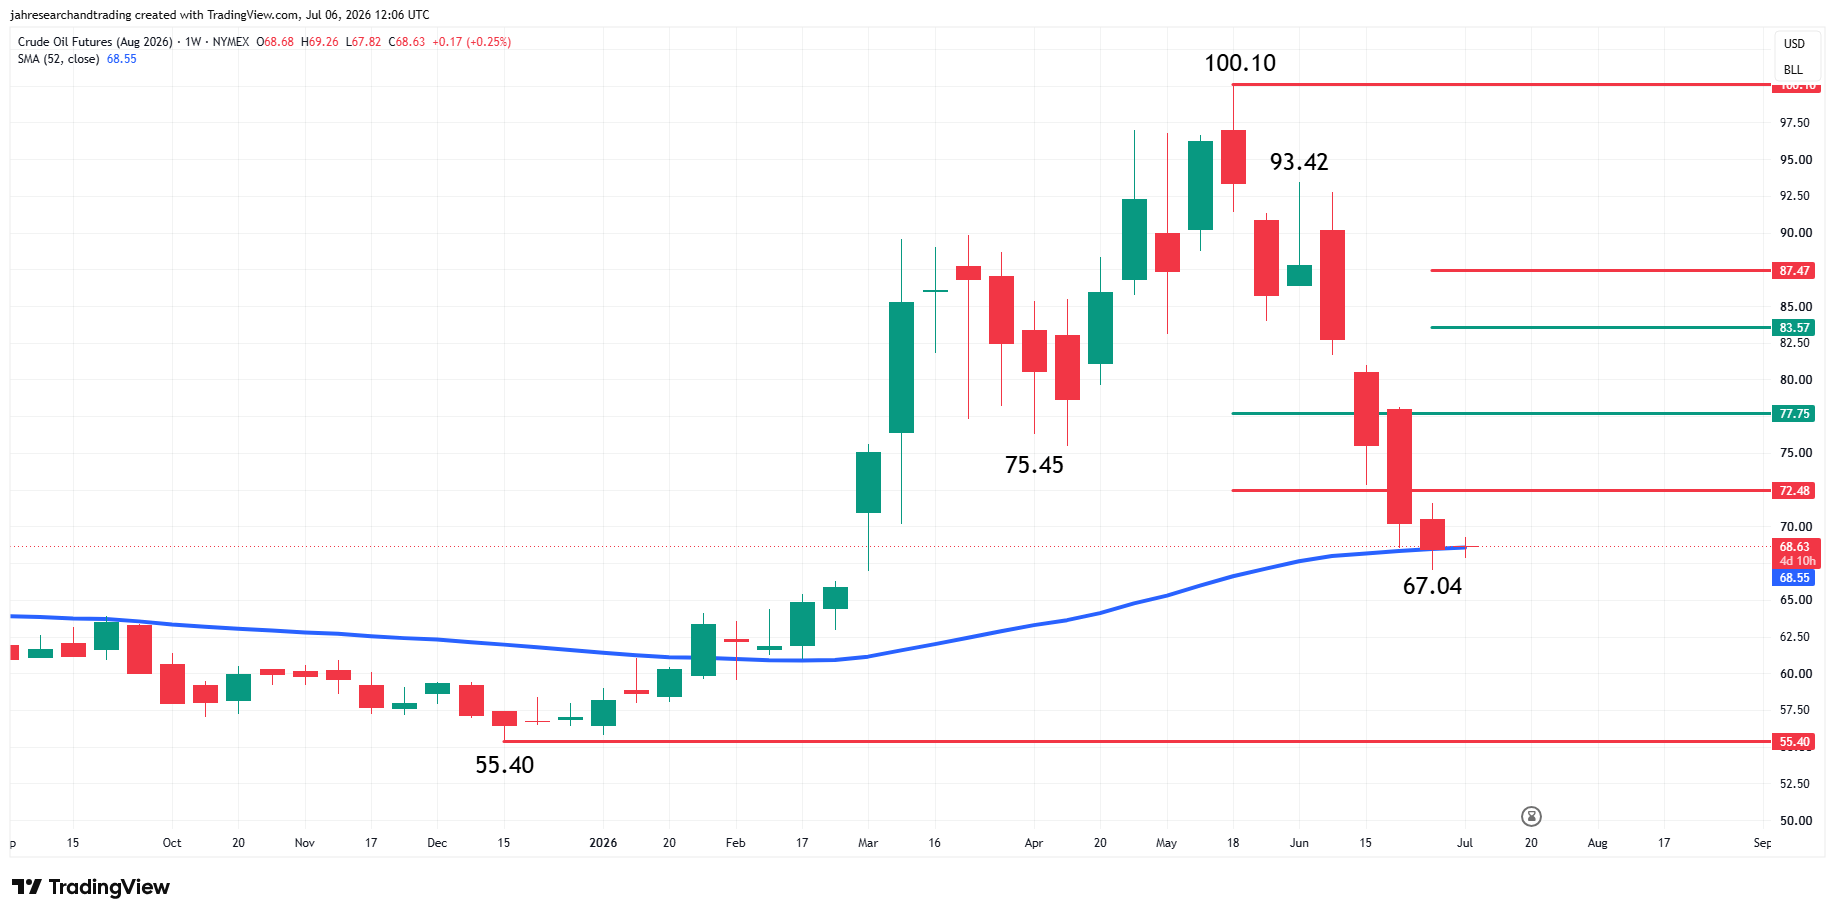
August WTI crude oil futures are in a downtrend according to the weekly swing chart. A trade through $67.04 will reaffirm the downtrend with the December bottom at $55.40 a potential target. The main trend will change to up on a trade through $100.10. That is highly unlikely to occur over the near-term, however.
I don’t expect to see a change soon, but the market is seven weeks down from the main top, which puts it inside the window of time for a closing price reversal bottom. This chart pattern won’t change the trend, but it could lead to the start of a 2 to 3 week counter-trend rally.
If last week’s low at $67.04 remains intact, the reversal bottom won’t form, but we could see the start of a “W” formation, which tends to indicate the selling pressure is mitigating and the buying is getting a little stronger. The initial rally is going to be short-covering, and given the magnitude of the current break, it’s probably best that it forms a solid support base. Otherwise, any rally is not likely to last very long in terms of both price and time.
Another key indicator to watch this week is the 52-week moving average at $68.55. The market straddled this indicator last week and even closed on its strong side after the drop to $67.40. Trader reaction to this indicator is likely to set the tone this week.
A sustained move over the 52-week MA could fuel a short-covering rally, but the market will still face headwinds at the short-term 61.8% level at $72.48. Overcome this level and the rally could extend into the short-term 50% level at $77.75. I think this level is the potential trigger point for an acceleration to the upside.
Brent Oil Price Forecast
Every new Brent Oil analysis as it publishes, today's technical signal and key levels, live price — on one page.
See all Brent Oil forecastsWeekly September Brent Crude Oil Futures Technical Analysis
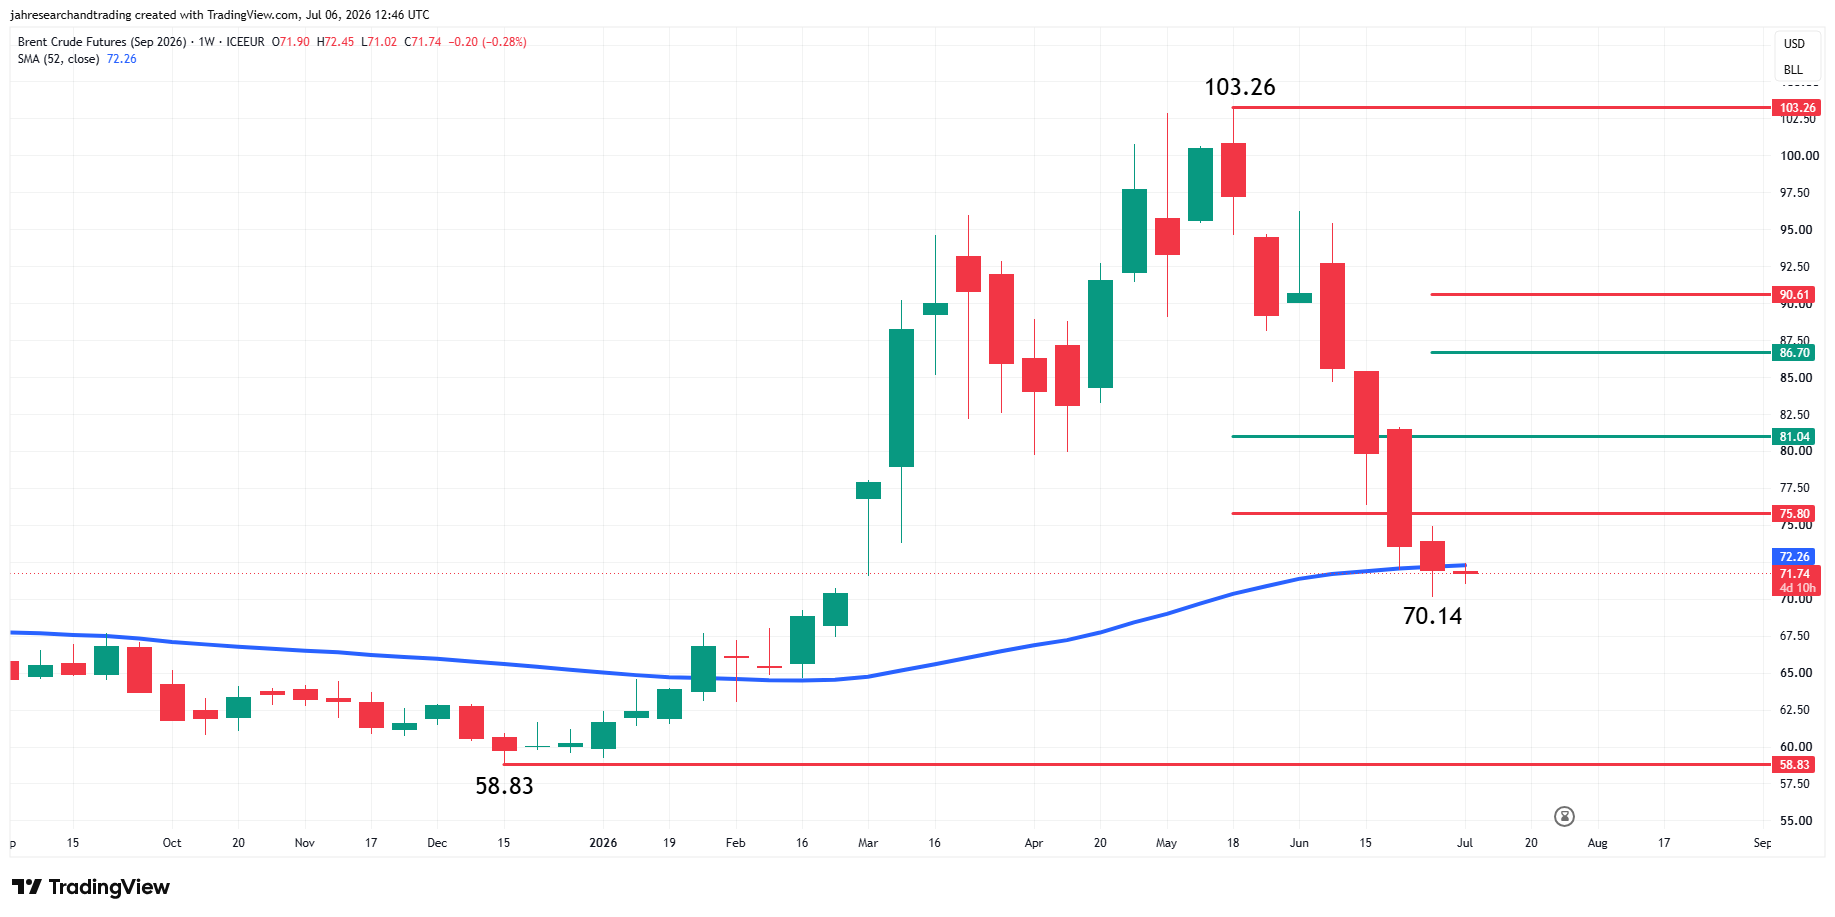
September Brent Crude Oil Futures are also in a downtrend on the weekly chart. A trade through $70.14 will signal a resumption of the downtrend. If the selling pressure is sustained, then the December bottom at $58.83 will hit the radar. Taking out $70.14 then finishing higher will form a closing price reversal bottom. A confirmation of this formation next week could trigger the start of a 2 to 3 week counter-trend rally.
If a reversal bottom doesn’t form then look for the start of a “W” formation. This will involve the combination of short-covering and aggressive counter-trend buying. The key to this formation will be the 52-week moving average at $72.26.
A sustained move over $72.26 this week could lead to a rally into the short-term 61.8% level at $75.80. Recovering this level and we could extend into the short-term 50% level at $81.04. I think this is the trigger point for an acceleration to the upside.
If enough buyers don’t show up to support the 52-week moving average, then we could see a hard liquidation break or a slow grind down toward $58.83.
Hormuz Recovery Is Costing Crude Every Week
Strait of Hormuz tanker traffic picked up again after the U.S.-Iran interim agreement. Still below pre-conflict levels. Insurance costs remain elevated and some shippers are cautious. But the trend has been one direction since the deal and crude keeps repricing it.
Saudi Arabia and several Gulf producers rebuilt exports during June. Abu Dhabi reportedly had to offer wider discounts to move cargoes, which tells you how fast the buyer’s market came back once shipping normalized.
The deal is interim. Nothing is signed permanently and any incident in the Gulf reprices crude overnight. But that has not happened and nobody is paying for the risk right now.
Fifth OPEC+ Increase With No Price Defense
OPEC+ approved another 188,000 barrels per day for August. Fifth consecutive monthly increase. Some members have not matched their announced targets due to operational constraints, but the group is putting barrels back and not defending price.
Non-OPEC supply is expanding at the same time. Physical discounts are widening. The spring rally was built on disruption risk. OPEC+ and non-OPEC producers are both working against what is left of it.
Banks Are Bearish and Goldman Is the Optimist
Goldman Sachs dropped its Brent forecast to roughly $75 next year after the U.S.-Iran agreement. That was the bullish call. Goldman still flagged upside risk if inventories tighten or Hormuz stalls, but the number came down regardless.
J.P. Morgan did not bother hedging. Roughly $60 on Brent next year. Additional supply coming online, demand growth slowing, and Chinese consumption falling short of every projection this year. A Reuters survey backed it up with analysts across the board cutting forecasts. OPEC and the IEA have both walked back their demand growth estimates and neither expects the pace they projected earlier to hold.
What to Watch
Hormuz shipping and EIA inventory data are the two releases that set direction this week. OPEC and the IEA both update their assessments too, and both have been cutting demand growth estimates with Chinese consumption the biggest miss. OPEC+ just approved its fifth consecutive monthly increase and nobody expects them to stop. Draws from the EIA would be the first thing to challenge that bearish setup. Anything else keeps sellers in control near resistance.
WTI and Brent are both seven weeks off the main tops, sitting on the 52-week moving averages with no reversal signal. The December lows are what is below if these levels fail.
If you’d like to know more about how to trade crude oil, please visit our educational area.



