



EUR/USD respects technical analysis
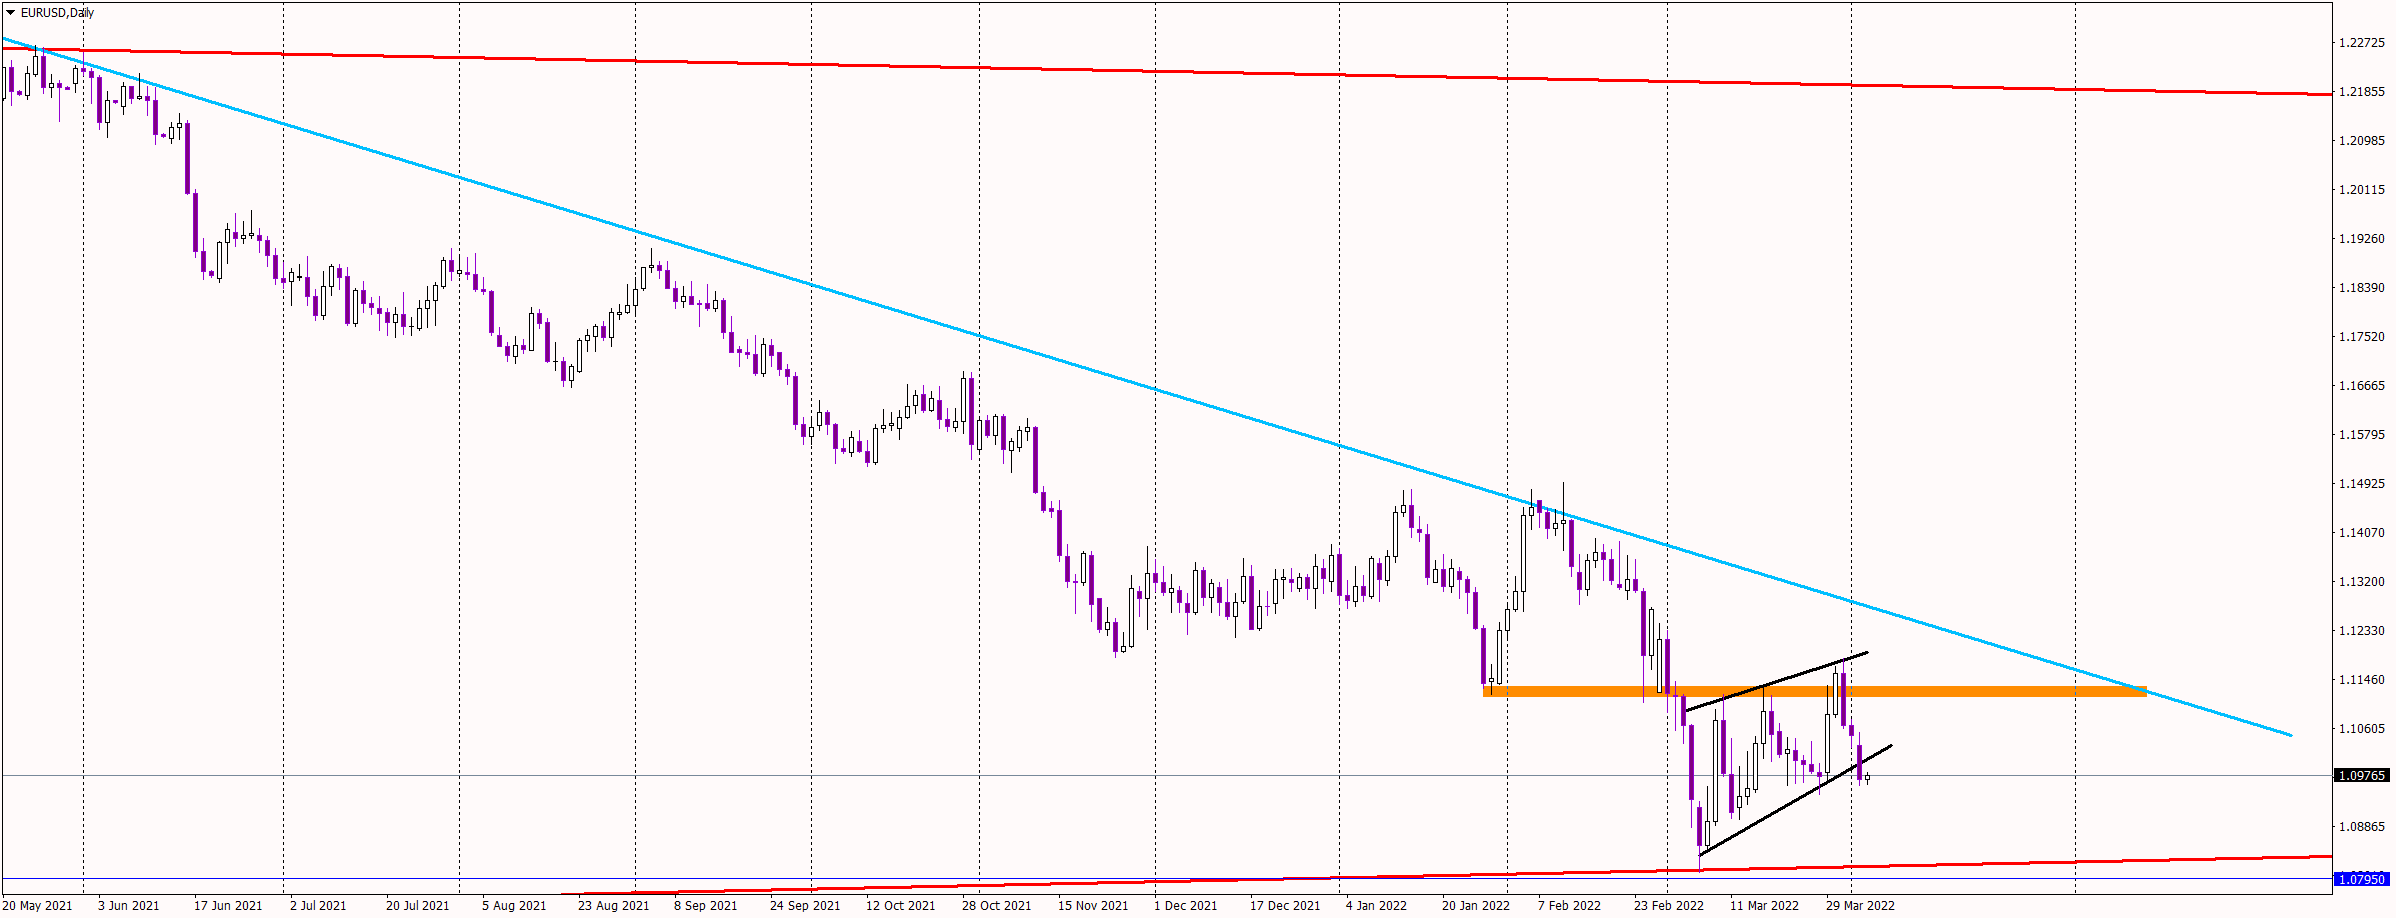
What’s great here is that everything happens for a reason. At least the technical reason. Firstly, the main downtrend stopped around 1.08. Why there? That was the place we had the lower line of a long-term symmetric triangle pattern (red), which is a great spot to capture some profits.
The bullish bounce formed a flag pattern (black). Flags promote the breakout in the direction of a trend. So in this case to the downside and this kind of breakout happened yesterday! According to price action rules, that ends the correction and gives us a mid-term sell signal.
What now for the EUR/USD?
The most probable scenario for now is a further drop. As for the target, it seems like the lower line of the triangle will be tested again. That gives us a possible movement of around 150 pips.
Keep in mind that the price can go even further. A breakout of the lower line of the triangle would mean and amazing, long-term sell signal but it that doesn’t seem to be the story for the nearest future.
For a look at all of today’s economic events, check out our economic calendar.