
Advertisement
Advertisement
EUR/USD Mid-Session Technical Analysis for August 10, 2015
By:
Daily EUR/USD Technical Analysis The EUR/USD is trading slightly better at the mid-session. Earlier in the session, the Forex pair followed-through to the
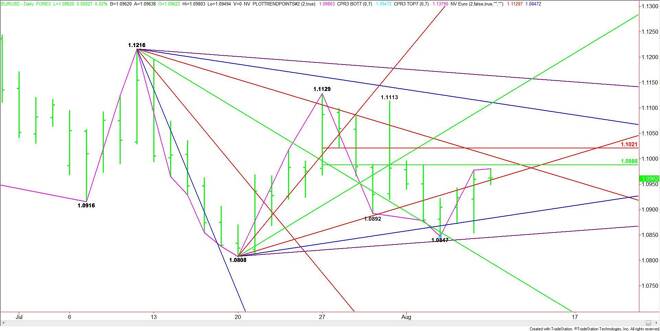
Daily EUR/USD Technical Analysis
The EUR/USD is trading slightly better at the mid-session. Earlier in the session, the Forex pair followed-through to the upside after Friday’s strong rally, but sellers came in at 1.0980, slightly below a key 50% level.
The main trend is down on the daily swing chart. The main range is 1.1129 to 1.0847. Its retracement zone at 1.0988 to 1.1021 is the primary upside target. A downtrending angle passes through this zone at 1.1006, making it a valid upside target also.
If the rally continues today, then it is likely to be a labored affair with potential resistance at 1.0988, 1.1006 and 1.1021. The Fibonacci level at 1.1021 is a potential trigger point for an acceleration to the upside with the next potential target over the near-term, a downtrending angle at 1.1111.
Currently, the market is straddling an uptrending angle at 1.0958. Trader reaction to this angle will determine the direction of the market into the close. The daily chart indicates there is no support under 1.0958 until the next uptrending angle at 1.0883.
Any rally is likely to be labored today, but the EUR/USD is wide open to the downside.
2-Hour EUR/USD Technical Analysis
The main trend is up according to the 2-Hour swing chart. However, the EUR/USD has been having trouble with a 50% level all session and appears to be setting up for an intraday break down.
The main range is 1.1113 to 1.0847. Its retracement zone is 1.0980 to 1.1011. The lower or 50% level at 1.0980 stopped the rally a few hours ago. Overcoming 1.0980 will signal the presence of buyers. This could trigger a rally over the swing top at 1.0987. This could create enough upside momentum to challenge the Fibonacci level at 1.1011.
Taking out the Fib level at 1.1011 could trigger an acceleration to the upside since the next potential target is a main top at 1.1113.
A sustained move under 1.0980 will signal the presence of sellers. The new short-term range is 1.0855 to 1.0980. If the selling pressure persists then look for the break to extend into its retracement zone at 1.0918 to 1.0903.
Based on the current price, the direction of the market into the close will be determined by trader reaction to 1.0980. If there is a sell-off, then the next decision area will be 1.0918 to 1.0903.
About the Author
James Hyerczykauthor
James Hyerczyk is a U.S. based seasoned technical analyst and educator with over 40 years of experience in market analysis and trading, specializing in chart patterns and price movement. He is the author of two books on technical analysis and has a background in both futures and stock markets.


Advertisement