Advertisement
Advertisement
EUR/USD Mid-Session Technical Analysis for August 14, 2015
By:
Daily EUR/USD Technical Analysis The EUR/USD is trading flat at the mid-session. After surging to the upside on Wednesday, momentum has slowed, indicating
Daily EUR/USD Technical Analysis
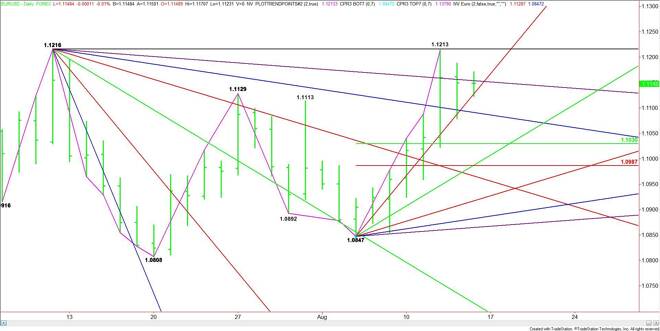
The EUR/USD is trading flat at the mid-session. After surging to the upside on Wednesday, momentum has slowed, indicating the market may be going through a transition period, which may lead to the start of a near-term correction.
The EUR/USD posted a low earlier in the session at 1.1123. This lined up with a steep uptrending angle at 1.1127. A failure to hold this angle opens up the market for a steep decline.
The first downside target under 1.1127 is a downtrending angle at 1.1091.
The main range is 1.0847 to 1.1213. Its retracement zone is 1.1030 to 1.0987. If the angle at 1.1091 fails as support then the retracement zone becomes the primary downside target.
Holding above 1.1127 will indicate the presence of buyers. Overcoming the next downtrending angle at 1.1154 will signal the buying is getting stronger.
The main upside target today is 1.1213 to 1.1216.
Based on the current price at 1.1155, the direction of the EUR/USD into the close will be determined by trader reaction to the angle at 1.1154.
2-Hour EUR/USD Technical Analysis
The main trend is up according to the 2-Hour Swing chart. However, the tone of the EUR/USD may be weakening because of the secondary lower closing price reversal top at 1.1171.
A trade through 1.1123 will confirm this potentially bearish chart pattern. If this price is taken out with conviction then look for an acceleration to the downside since the next target is a 50% level at 1.1086 and a main bottom at 1.1079.
A trade through 1.1079 will turn the main trend to down on the 2-Hour Chart. This should lead to a test of the Fibonacci level at 1.1057. This price is also a potential trigger point for a steep downside move with 1.0960 the next likely target.
The short-term range is 1.1213 to 1.1079. Its pivot is 1.1160. This price is controlling the short-term direction of the market. A sustained move under this price will signal the presence of sellers.
Overcoming and sustaining a move over 1.1160 will signal the presence of buyers. Taking out the closing price reversal top at 1.1171 will negate the chart pattern. This could trigger a surge into the August main top at 1.1213 and the July 10 main top at 1.1216.
Based on the current price at 1.1155, the direction of the market the rest of the session based on the 2-Hour chart will be determined by trader reaction to the short-term 50% level at 1.1160.
About the Author
James Hyerczykauthor
James Hyerczyk is a U.S. based seasoned technical analyst and educator with over 40 years of experience in market analysis and trading, specializing in chart patterns and price movement. He is the author of two books on technical analysis and has a background in both futures and stock markets.
Advertisement
