
Advertisement
Advertisement
EUR/USD Mid-Session Technical Analysis for November 4, 2015
By:
Daily EUR/USD Technical Analysis The EUR/USD is trading lower at the mid-session. The main trend is down according to the daily swing chart. The current
Daily EUR/USD Technical Analysis
The EUR/USD is trading lower at the mid-session.
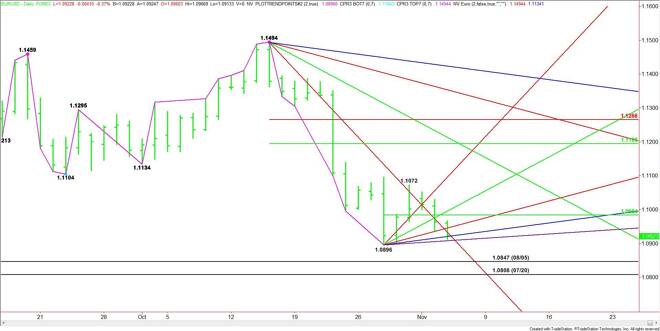
The main trend is down according to the daily swing chart. The current price at 1.0926 has put the EUR/USD in a position to challenge the recent bottom at 1.0896. A trade through this level will signal a resumption of the downtrend.
Based on the current price at 1.0926, the key angle to watch is a steep, long-term downtrending angle at 1.0934. The market is basically walking down this angle. Trader reaction to this angle will determine the direction of the market into the close.
A sustained move under the angle at 1.0934 will indicate the presence of sellers. The break could become labored, however, because of uptrending angles at 1.0921 and 1.0909. The latter is the last potential support before the 1.0896 main bottom.
A sustained move over the angle at 1.0934 will signal the presence of buyers. This could trigger a short-covering rally into an uptrending angle at 1.0934. This could create enough upside momentum to trigger a strong short-covering rally into the pivot price at 1.0984.
Watch the price action and read the order flow at 1.0934. Trader reaction to this angle will tell us whether the bears are still in control, or if the buyers are regaining strength.
2-Hour EUR/USD Technical Analysis
The main trend is down according to the 2-Hour swing chart. Overnight, the EUR/USD broke through a short-term Fibonacci level at 1.0963, establish resistance then sold-off.
The current downside momentum suggests that the next major downside target is the October 28 main bottom at 1.0896.
There could be a technical bounce on the first test of 1.0896, but look for an acceleration to the downside if this level is taken out with conviction. The next two major downside targets are the August 7 bottom at 1.0855 and the August 5 bottom at 1.0847.
The major downside target this week is the 1.0808 main bottom from July 20.
The first target on the upside is the Fib level at 1.0963. If shorts continue to come in over this level then the move could continue into 1.0984 to 1.0996.
Watch the price action and read the order flow on a test of 1.0896. There is a strong possibility of a technical bounce on the initial test of this level.
About the Author
James Hyerczykauthor
James Hyerczyk is a U.S. based seasoned technical analyst and educator with over 40 years of experience in market analysis and trading, specializing in chart patterns and price movement. He is the author of two books on technical analysis and has a background in both futures and stock markets.


Advertisement