
Advertisement
Advertisement
EUR/USD Technical Analysis for November 12, 2015
By:
Daily EUR/USD Technical Analysis The EUR/USD is trading lower at the mid-session. Earlier in the session, the Forex pair broke out over a long-term
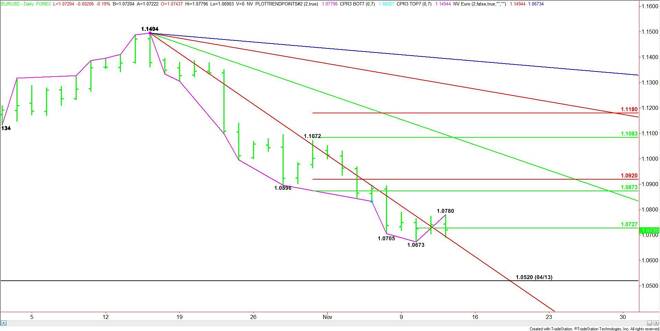
Daily EUR/USD Technical Analysis
The EUR/USD is trading lower at the mid-session. Earlier in the session, the Forex pair broke out over a long-term downtrending angle, but buyers could not hold on to the gains. This suggests that further consolidation may have to take place before a sustained rally can develop.
Technically, the main trend is down according to the daily swing chart.
The new minor range is 1.0673 to 1.0780. Its 50% level or pivot is 1.0727. Trader reaction to this level is likely to determine the direction of the EUR/USD into the close.
A sustained move over 1.0727 will signal the presence of buyers. This could lead to a retest of 1.0780.
If 1.0780 is taken out with conviction then the rally could extend into 1.0873 to 1.0920 over the near-term.
A sustained move under 1.0727 will indicate the presence of sellers. The first downside objective is the longer-term downtrending angle at 1.0694. Crossing to the weak side of this angle will put the EUR/USD in a bearish position once again with 1.0673 the next likely target.
A trade through 1.0673 will signal a resumption of the downtrend. This could trigger an acceleration to the downside with the April 13 main bottom at 1.0520 the next potential downside target.
Watch the price action and read the order flow at 1.0727 the rest of the session. This will tell us if the sellers are still in control, or if a shift in investor sentiment is taking place.
2-Hour EUR/USD Technical Analysis
The main trend is down according to the 2-Hour EUR/USD swing chart.
The main range is 1.0897 to 1.0673. Its retracement zone is 1.0785 to 1.0811. The lower or 50% level essentially stopped rallies twice this week at 1.0773 and 1.0780.
The short-term range is 1.0673 to 1.0780. Its retracement zone is 1.0727 to 1.0714. Trader reaction to this zone will likely determine the direction of the market into the close.
Look for a bullish tone to develop on a sustained move over 1.0727. This move may create enough upside momentum to challenge the main top at 1.0780 and the 50% level at 1.0785. A trade through 1.0780 will turn the main trend to up.
A sustained move under the Fibonacci level at 1.0714 will signal the presence of sellers. The first target under this level is today’s low at 1.0690. This level is also a potential trigger point for an acceleration to the downside with the main bottom at 1.0673 the next likely target.
Watch the price action and order flow at 1.0727 and 1.0714 today. Taking out 1.0727 and sustaining the move should lead to a strong close. Taking out 1.0714 with conviction will indicate that sellers are still in control.
About the Author
James Hyerczykauthor
James Hyerczyk is a U.S. based seasoned technical analyst and educator with over 40 years of experience in market analysis and trading, specializing in chart patterns and price movement. He is the author of two books on technical analysis and has a background in both futures and stock markets.


Advertisement