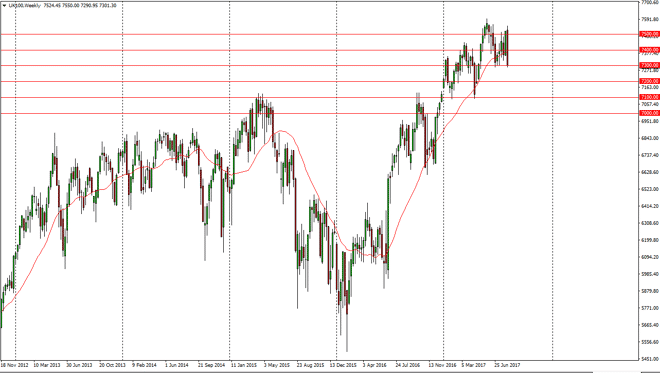
The FTSE 100 fell rather significantly during the week, forming a very bearish engulfing candle. By breaking down to the 7300 level, the market looks very
The FTSE 100 fell rather significantly during the week, forming a very bearish engulfing candle. By breaking down to the 7300 level, the market looks very bearish suddenly. A breakdown below the bottom of the weekly candle should send this market down to the 7200 level, and then possibly the 7100 level. I think that the GBP/USD pair is also a market that you should be paying attention to, as it is the purest measure of an economy. It looks likely that the market should continue to find bearish pressure, but it’s not until we break down below the bottom of the weekly candle that I’m willing to put money to work. This is because we could get a bit of a bounce from here, because it has been an area of interest in the past. All things being equal, it does look like the sellers are starting to step into the market and express strength.
Chris is a proprietary trader with more than 20 years of experience across various markets, including currencies, indices and commodities. As a senior analyst at FXEmpire since the website’s early days, he offers readers advanced market perspectives to navigate today’s financial landscape with confidence.