GBPUSD extended its upside movement from 1.1946 to as high as 1.3652, facing a major resistance trend line from 1.7190 to 1.5016 on its weekly chart. As
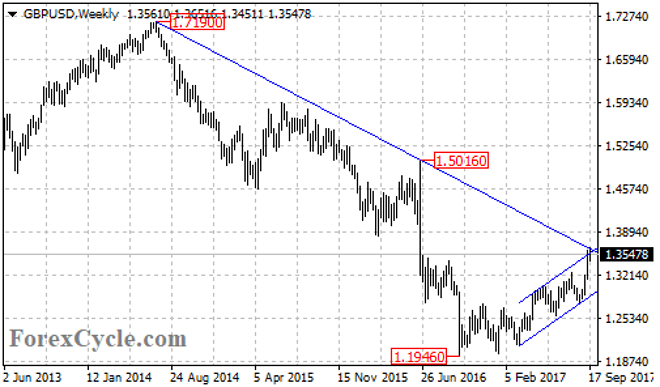
GBPUSD extended its upside movement from 1.1946 to as high as 1.3652, facing a major resistance trend line from 1.7190 to 1.5016 on its weekly chart. As long as the price is below the trend line, the bounce from 1.1946 could be treated as consolidation of the long term downtrend from 1.7190, and another fall could be expected after the consolidation.
The GBPUSD pair failed in its attempt to break above the resistance trend line on the weekly chart and moved sideways in a trading range between 1.3451 and 1.3652 on the 4-hour chart. Near term support is at 1.3451, a breakdown below this level could bring price back towards the rising trend line now at 1.3360. This rising trend line acts as a key support for the uptrend from 1.2774, a clear break below could indicate that the uptrend had completed at 1.3652 already, then the following downside movement could take price to 1.2900 area.
There is a bullish trend line from 1.2109 to 1.2774 with support at around 1.2900 on the daily chart. A clear break below this trend line could signal resumption of the long term downtrend from 1.7190.
As long as the price is above the trend line on the 4-hour chart, the upside movement from 1.2774 could be expected to continue and a break of 1.3652 resistance could take price to next resistance level at the 38.2% Fibonacci retracement taken from 1.7190 to 1.1946 at 1.3950. The 1.3950 level would be the final target for the whole upside move started from 1.1946.
Support levels: 1.3451 (near term support), 1.3360 (the rising trend line on the 4-hour chart), 1.3153 (the September 14 low), 1.2900 (the bullish trend line on the daily chart), 1.2774 (the August 24 low), 1.2109 (the March 14 low), 1.1946 (the October 2016 low).
Resistance levels: 1.3652 (the major resistance trend line on the weekly chart), 1.3950 (the 38.2% Fibonacci retracement).