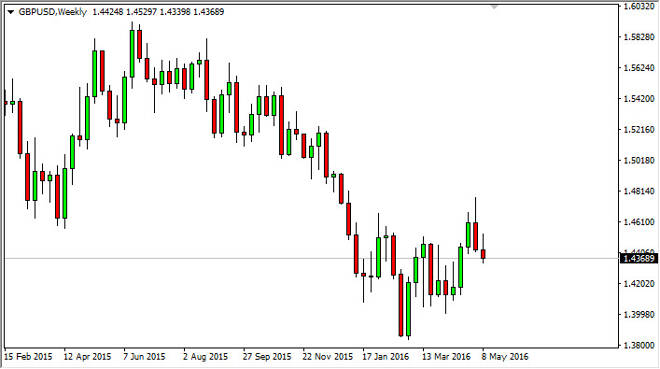
The GBP/USD pair initially tried to rally during the course of the week, but turned back around and the 1.45 level to form a bit of a shooting star. This
The GBP/USD pair initially tried to rally during the course of the week, but turned back around and the 1.45 level to form a bit of a shooting star. This of course is a negative sign, and as a result we believe that the market will probably drift lower. However, it is a very noisy area just below, so it’s probably going to be easier to trade this market from a shorter-term chart as opposed to a weekly one. Volatility should continue to be the way going forward.
Chris is a proprietary trader with more than 20 years of experience across various markets, including currencies, indices and commodities. As a senior analyst at FXEmpire since the website’s early days, he offers readers advanced market perspectives to navigate today’s financial landscape with confidence.