The GBP/USD pair initially fell during the session on Friday, but turned around to form a hammer. The hammer of course is a bullish sign, and it looks as
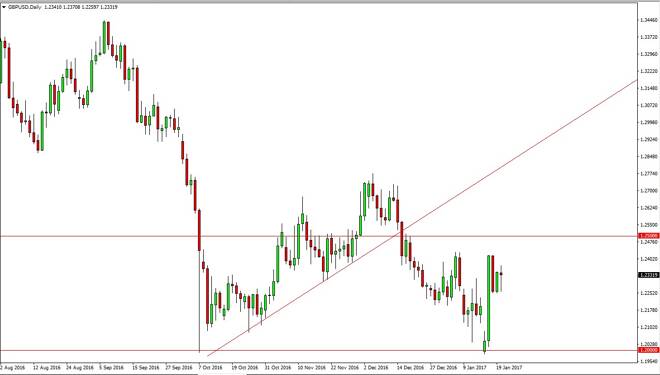
The GBP/USD pair initially fell during the session on Friday, but turned around to form a hammer. The hammer of course is a bullish sign, and it looks as if we’re going to reach towards the 1.25 level above. That is a massive amount of resistance though, so it’s not until we break above there that I feel comfortable buying. If we can break down below the bottom of the hammer for the session on Friday, I feel that the market will then reach down to the 1.20 level. Ultimately, I expect volatility more than anything else.
Chris is a proprietary trader with more than 20 years of experience across various markets, including currencies, indices and commodities. As a senior analyst at FXEmpire since the website’s early days, he offers readers advanced market perspectives to navigate today’s financial landscape with confidence.