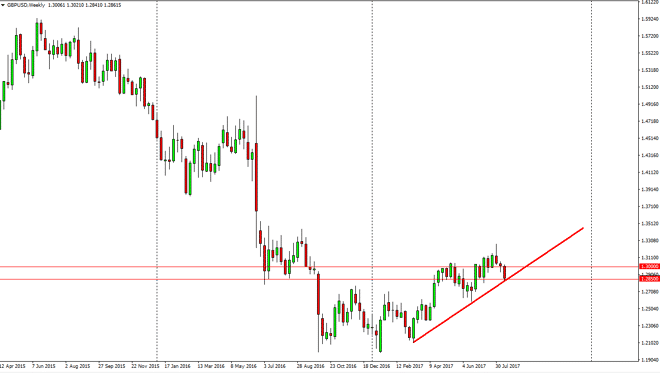
The British pound fell significantly during the week, testing the 1.2850 level for support. Not only that, there is a potential uptrend line that dissects
The British pound fell significantly during the week, testing the 1.2850 level for support. Not only that, there is a potential uptrend line that dissects the market right there, so I think that the next candle could be rather important. Currently, it does look like for try to break down and if we do break below the 1.28 handle, I think the sellers will jump in and push this market towards the 1.25 level. Alternately, a bounce could happen but I’m not interested in buying that bounce until we clear the 1.30 level handily, perhaps on a daily chart. Overall, it looks as if the sellers are out in full force when it comes to the British pound around the Forex world.
Chris is a proprietary trader with more than 20 years of experience across various markets, including currencies, indices and commodities. As a senior analyst at FXEmpire since the website’s early days, he offers readers advanced market perspectives to navigate today’s financial landscape with confidence.