The GBP/USD pair broke out during the week, clearing the 1.2750 level. That being the case, I think that the market is going to reach towards the top of
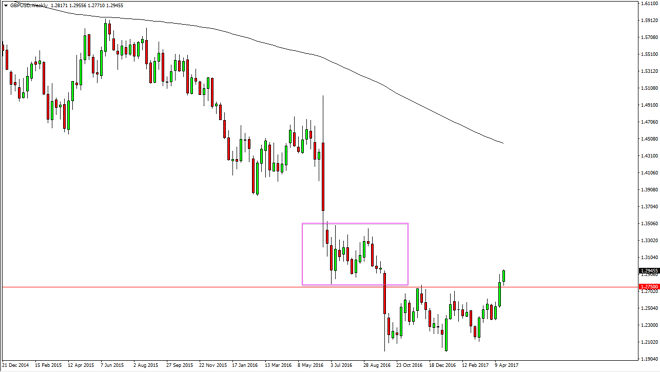
The GBP/USD pair broke out during the week, clearing the 1.2750 level. That being the case, I think that the market is going to reach towards the top of the previous consolidation area, near the 1.3450 level. I believe that it could be choppy, but we certainly have broken out to the upside and above a significant level. Pullbacks should continue to offer buying opportunities and if we are above the 1.2750 level, I don’t have any interest in shorting this market. It is possible that the longer-term downtrend is finally broken.
Chris is a proprietary trader with more than 20 years of experience across various markets, including currencies, indices and commodities. As a senior analyst at FXEmpire since the website’s early days, he offers readers advanced market perspectives to navigate today’s financial landscape with confidence.