The British pound went sideways during most of the session on Wednesday, hugging the 1.2850 level. The market is waiting to see with the Federal Reserve
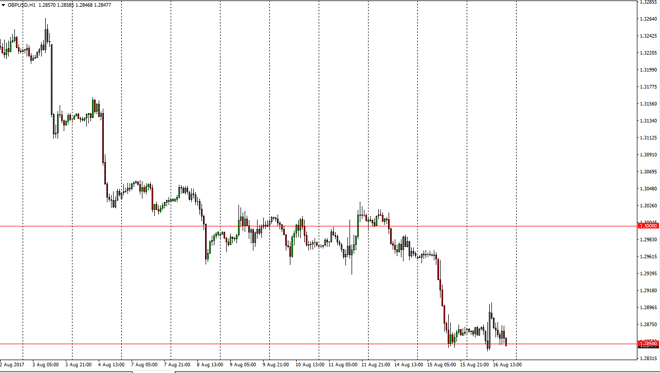
The British pound went sideways during most of the session on Wednesday, hugging the 1.2850 level. The market is waiting to see with the Federal Reserve is thinking, and the Meeting Minutes could have a lot to do with where we go next. If we break down below the bottom of the daily range, then I think we probably go to the 1.2750 level underneath, which has been important in the past. Alternately, if we break above the 1.29 level, then we have to do with the 1.30 level above. I don’t have any interest in buying, least not until we break above the 1.3050 level, because quite frankly it would show a complete switch in the overall momentum of the market. Until then, I remain bearish but recognize that the choppiness should continue.
Chris is a proprietary trader with more than 20 years of experience across various markets, including currencies, indices and commodities. As a senior analyst at FXEmpire since the website’s early days, he offers readers advanced market perspectives to navigate today’s financial landscape with confidence.