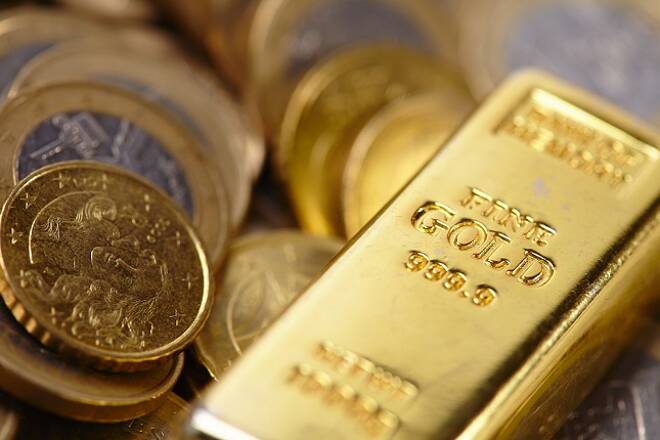
Let's start with Gold Great.
‘Twas just 59 trading days ago on 08 March that Gold traded down to the year’s low of 1673. But since then, yesterday’s (Friday’s) settle at 1904 marks a 231-point gain. Thus to again revisit our proportional math class from back in 7th grade:
“59 trading days is to 231 points as 150 trading days [remaining in this year] is to X points”
Which added to Gold’s present level of 1904 would put Gold at 2491 come New Year’s Eve. Which exceeds our forecast high for this year of 2401 by 90 points. That’s pretty Gold Great, eh?
Now in turning to Gold’s weekly bars from a year ago-to-date, one may rightly say, “Well, all that straight line math makes for a good story, but…” given markets move in anything but a straight line. Further, the pure technician can readily point to all the previous price to-and-fro in our chart below to keep a lid on the show:
However, the fundamental realist need only cite the Dollar’s rampant debasement (its $20.5 trillion supply by “M2” +14.0% year-over-year), President Biden’s “plan” to increase spending by another $6 trillion (that’s 29.3% of the present money supply), stagflation on the come, and of course our opening Gold Scoreboard’s present valuation of 3844. All of which is inarguably supported by the 3Ds of Debasement, Debt and Derivatives. Gold Great indeed.
As for Gold Sedate let’s pause a moment for price perspective by looking at our standings for the BEGOS Markets thus far for 2021 with five full trading months in the books; (as you know, Monday being a StateSide holiday, its abbreviated trading session is to be accounted as part of 01 June).
And as we see in the table, Gold year-to-date is all but “unch” in having settled last year at 1902, just two points below today’s level of 1904. Not (yet) any stagflation bid there. Gold Sedate indeed. But with Oil and Copper dominating this year’s performances, their rise with the economy’s pending demise shall all but you surprise, (given you read The Gold Update):
“So the Economic Barometer is now sensing some stagflation, eh mmb?”
Squire, ’tis a bit startling that little if any mention is made of stagflation (yet) through most of the “rah-rah” media. “Oh the economic boom is coming!”, they say. “Oh we’ll get the money to turn the world green!”, they say. “Oh international taxation shall point the way!”, they say.
Ok. Looking at this past week’s incoming metrics for the Econ Baro, here’s what we say: Q1’s Gross Domestic Product Chain Deflator was revised upward: that’s inflation. April’s Core Personal Consumption Expenditures Index — the Federal Reserve’s favoured gauge of inflation — increased 75% over that from March to an annualized rate of +8.4%, quadruple the Fed’s target rate: say it again, that’s inflation.
The month’s Personal Spending practically dried up whilst Personal Income fell 13.1%. Growth in April’s New Home Sales markedly slowed and the month’s Pending Home Sales fell 4.4%. And Durable Orders fell 1.3%. As well, The Conference Board’s read on May’s Consumer Confidence fell. That’s shrinkage. Back to math class once again:
Oh and from the “Has The Market Crashed Yet? Dept.”, the “live” price/earnings ratio of the S&P 500 is now 52.5x (Bob Shiller pegs it at 44.7x): recall contextually from business school that 15x is “expensive” and over 20x is “stooopid”. And as we oft remind: mind the website’s MoneyFlow page, its quarterly measure for the S&P citing it as 277 points “high”, (which is modest given a 50% “correction” would still find the Index overvalued). And by the Baro, the suggested “massive top” for the S&P (red line) continues to broaden:
“But mmb, we’re still told that people have a lot of money to go into the market…”
A valid observation there, Squire. So if “it” is there, why isn’t “it” going into the market? The S&P one month ago (29 April) was 4211. Today ’tis essentially the same at 4204. And yet the monthly MoneyFlow (as regressed into S&P points) is 130 points lower. (You won’t see that on CNBS).
That’s a “stealth drain” of dough out of the S&P. Which throughout history we know leaves Joe Blow holding the bag when it all goes wrong. And yet, ’tis as if the entire equities investing community is a bloated fat ostrich with its head inextricably buried in quicksand along the banks of da Nile.
Then too on the FedSide, there are musings of slowing their stimuli as the past week’s FedSpeak found both Vice Chair Richard “Clearly” Clarida and Dallas FedPres Robert “Cap it” Kaplan leaning toward asset purchase reductions. The point is: if “it” isn’t really as plentiful as thought, and moreover “it” via the Fed isn’t being as sought, just make sure ’tis Gold that you’ve bought.
‘Course if you’d bought Gold at this time a year ago, you’re ahead of the game. Here is its percentage track from then-to-now along with those of these key metals equities, their performances being: Franco-Nevada (FNV) +6%, Gold itself +9%, Agnico Eagle Mines (AEM) +12%, both Pan American Silver (PAAS) and the VanEck Vectors Gold Miners exchange-traded fund (GDX) +15%, Newmont (NEM) +26%, and the Global X Silver Miners exchange-traded fund (SIL) +35%:
Next let’s assess the “Rising Tide of Inflation Lifts All Boats Dept.” In going ’round the horn for all eight components of the BEGOS Markets across their past 21 trading days (one month) we find every diagonal trendline as positive, albeit barely so for the Bond and Copper, (their baby blue dots of trend consistency being anything but). But which market shows the best trend consistency?
Gold, (which for you “r-squared” fans out there at present reads as 0.94: that’s pretty close to perfection). ‘Course for the contrarian, such shan’t last, and combined with Gold trading at the big round number of 1900 may be cause for some shoving about through here:
Now to our 10-day Market Profiles for Gold on the left and for Silver on the right. As denoted, the key trading support area for Gold near-term is the 1870’s whilst same for Sister Silver is the upper 27s:
So it being month-end means ’tis time once again for Gold’s broad structure graphic by the month from some 10 years ago-to-date. Several more “candles” like the rightmost one for May and our upper right 2401 forecast can come into play:
In fact the above graphic sums it all up quite well: for at the end of the day — and in this case the month — hardly is Gold sedate, indeed of late ’tis ever so great!
“Oh, yer lookin’ great there, baby…”
Cheers!
…m…
Mark Mead Baillie is the founder and Principal of de Meadville International, the centerpiece of which is the markets' analytics and commentary website www.deMeadville.com, also the home of his ever-popular weekly missive "The Gold Update".