Based on the early trade, the direction of the December Comex Gold futures contract on Monday is likely to be determined by trader reaction to the pivot at $1232.00.
December Comex Gold futures are trading nearly flat shortly after the regular session opening on Monday. Volume is low and investors appear to be holding the market in a range ahead of this week’s string of central bank policy statements.
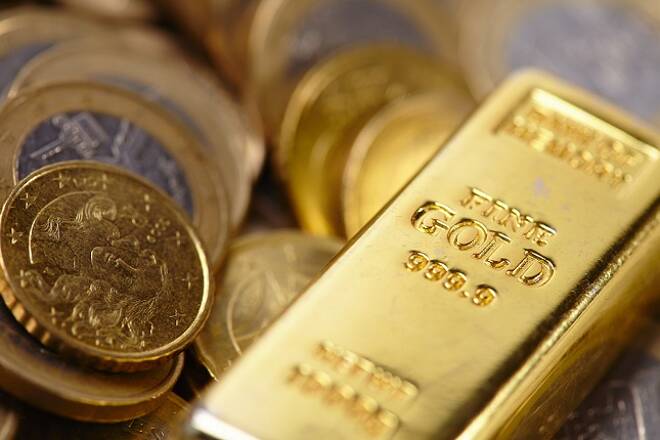
In other news, hedge funds and money managers increased their net short position in COMEX gold contracts to a record high in the week to July 24, U.S. Commodity Futures Trading Commission (CFTC) data showed on Friday.
The main trend is down according to the daily swing chart. The trend will change to up on a trade through $1244.70. A move through $1221.00 will signal a resumption of the downtrend.
The short-term range is $1221.00 to $1244.70. Its 50% level or pivot is $1232.90. This price may be controlling the near-term direction of the market.
The main range is $1278.20 to $1221.00. If the trend changes to up then its retracement zone at $1249.70 to $1256.40 will become the primary upside target.
Based on the early trade, the direction of the December Comex Gold futures contract on Monday is likely to be determined by trader reaction to the pivot at $1232.00.
A sustained move under $1232.00 will indicate the presence of sellers. This could drive the market into an uptrending Gann angle at $1228.00, followed by another uptrending Gann angle at $1224.50. The latter is the last potential support angle before the $1221.00 main bottom.
A sustained move over $1232.00 will signal the presence of buyers. This could lead to a quick move into the downtrending Gann angle at $1234.70. Since the main trend is down, sellers could show up on the first test of this angle. Taking it out, however, could trigger an acceleration into the next downtrending Gann angle at $1239.70. This angle is the trigger point for another acceleration to the upside.
James Hyerczyk is a U.S. based seasoned technical analyst and educator with over 40 years of experience in market analysis and trading, specializing in chart patterns and price movement. He is the author of two books on technical analysis and has a background in both futures and stock markets.