Based on the current price at $1300.50 and the earlier price action, the direction of the August Comex Gold market today is likely to be determined by trader reaction to the Fibonacci level at $1300.60.
Gold futures are trading lower on Monday shortly before the regular session opening. Pressuring the market are rising U.S. Treasury yields and increased demand for higher risk assets. Traders could also be positioning themselves ahead Tuesday’s U.S. consumer inflation report and Wednesday’s Federal Open Market Committee interest rate decision and monetary policy statement. Traders will also be looking at the Fed’s economic projections for clues as to the timing and number of future rate hikes.
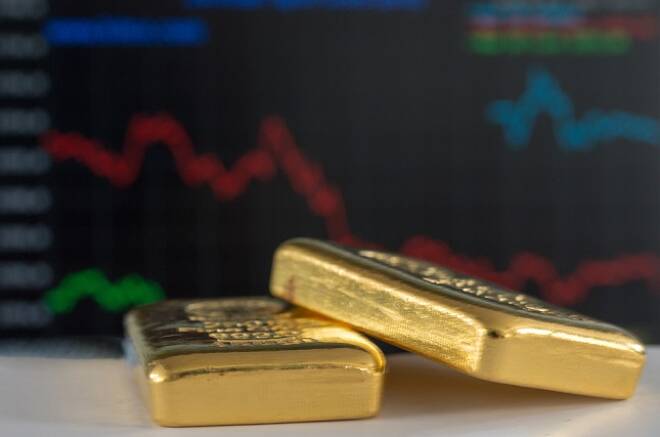
At 1155 GMT, August Comex Gold is trading $1300.40, down $2.20 or -0.18%.
The main trend is down according to the daily swing chart. A trade though $1286.80 will signal a resumption of the downtrend.
The minor trend is also down. A trade though $1307.80 will change the minor trend to up. This will also shift momentum to the upside. A move through $1296.00 will indicate the return of sellers.
Controlling the near-term direction of the gold market is the major retracement zone at $1315.60 to $1300.60. The market is currently straddling the lower of Fibonacci level of this range at $1300.60.
The short-term range is $1332.40 to $1286.80. Its retracement zone is potential resistance at $1309.60 to $1315.00.
The strongest resistance on the chart is the price cluster at $1315.00 to $1315.60.
Based on the current price at $1300.50 and the earlier price action, the direction of the August Comex Gold market today is likely to be determined by trader reaction to the Fibonacci level at $1300.60.
A sustained move over $1300.60 will indicate the presence of buyers. If this move generates enough upside momentum, we could see a further rally into the minor top at $1307.80, followed by the short-term 50% level at $1309.60.
A sustained move under $1300.60 will signal the presence of sellers. This could lead to a test of the minor bottom at $1296.00. This is followed by $1293.10 and $1292.00.
The sideways price action over the past three weeks suggests investor indecision and impending volatility. Short-term, watch the price action and read the order flow at $1300.60. Longer-term traders should do the same on a test of $1315.60. The market needs to overcome this level to turn gold bullish.
James Hyerczyk is a U.S. based seasoned technical analyst and educator with over 40 years of experience in market analysis and trading, specializing in chart patterns and price movement. He is the author of two books on technical analysis and has a background in both futures and stock markets.