
Gold’s Cautious Rebound Amid Inflation Concerns and Dollar Strength
This cautious trading environment reflects the impact of durable U.S. inflation and expectations of sustained high interest rates, which dampen the appeal of gold by raising the opportunity cost of holding non-yielding assets.
Similarly, strength in the U.S. dollar, near a three-month peak, further pressures gold prices. This sentiment extends to other precious metals, with platinum and silver futures also experiencing declines.
Meanwhile, copper prices dropped slightly, despite recent gains fueled by optimistic economic forecasts for China, the world’s largest copper importer.
Gold Prices Forecast
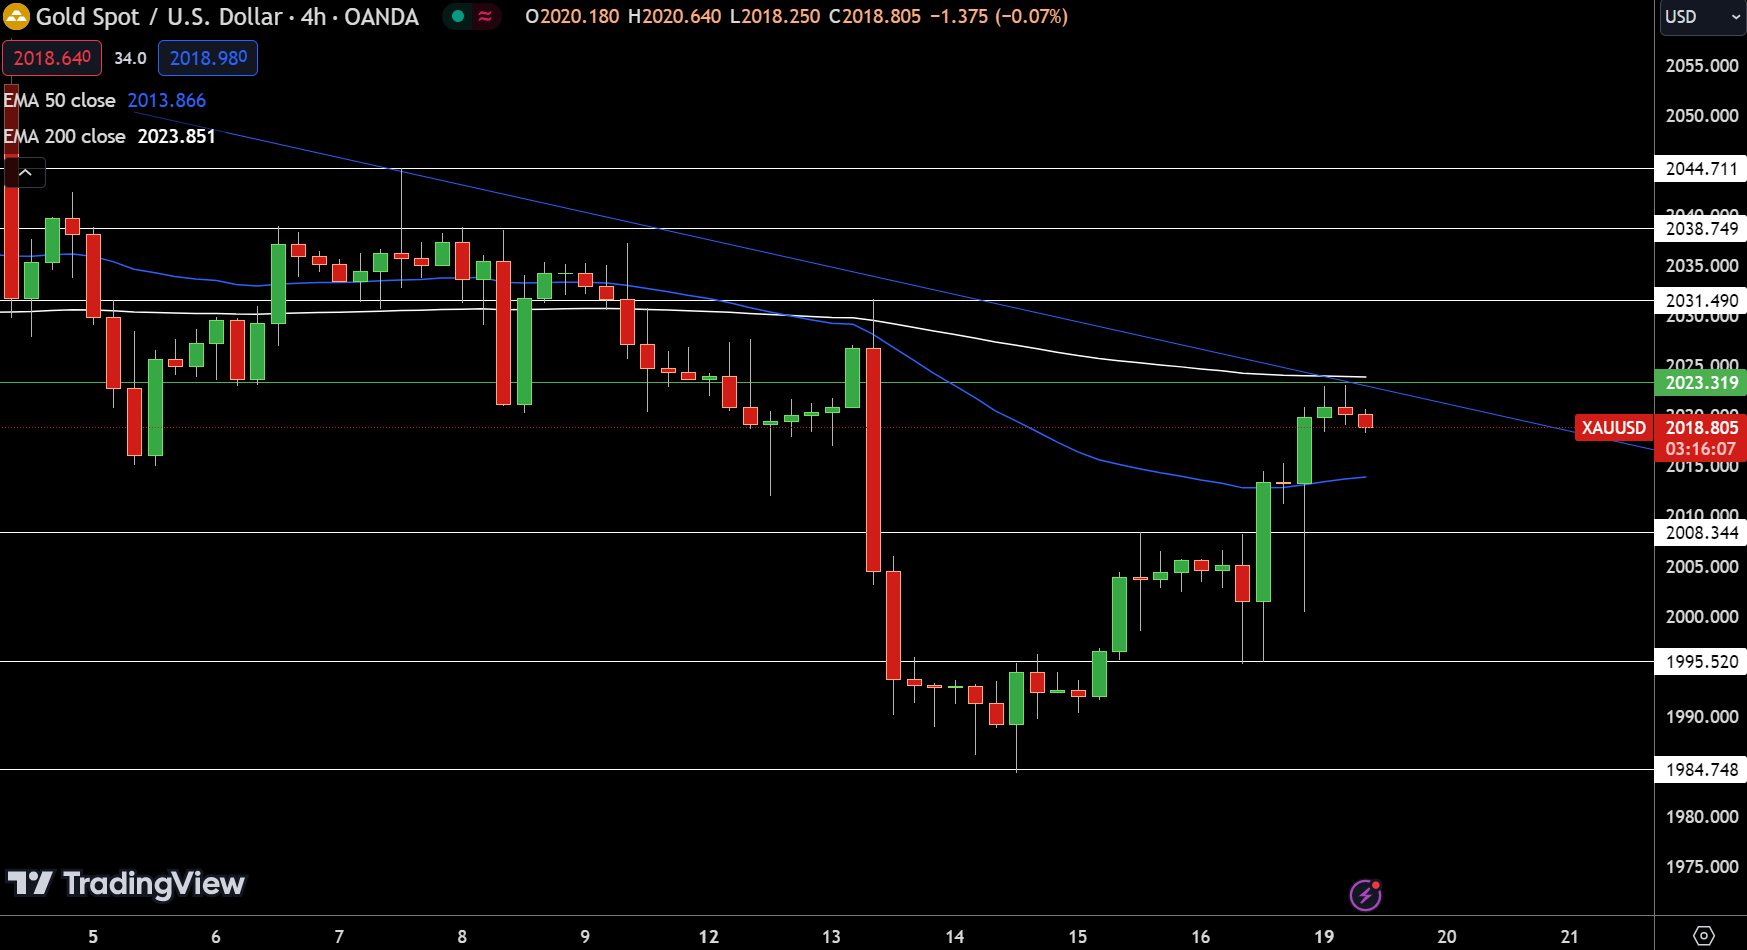
Today, gold slightly rose by 0.28%, reaching $2018.80, as investors continue to value it amidst market uncertainty. The critical pivot point is at $2023.32, with resistance levels at $2031.49, $2038.75, and $2044.71.
On the downside, support is seen at $2008.34, then $1995.52 and $1984.75. The 50-Day and 200-Day Exponential Moving Averages at $2,013.87 and $2,023.85, respectively, suggest a mixed sentiment.
Despite today’s gains, the market’s stance towards gold could turn bearish if it falls below $2023.32, indicating a cautious approach among traders regarding its immediate future trajectory.

Silver Prices Forecast
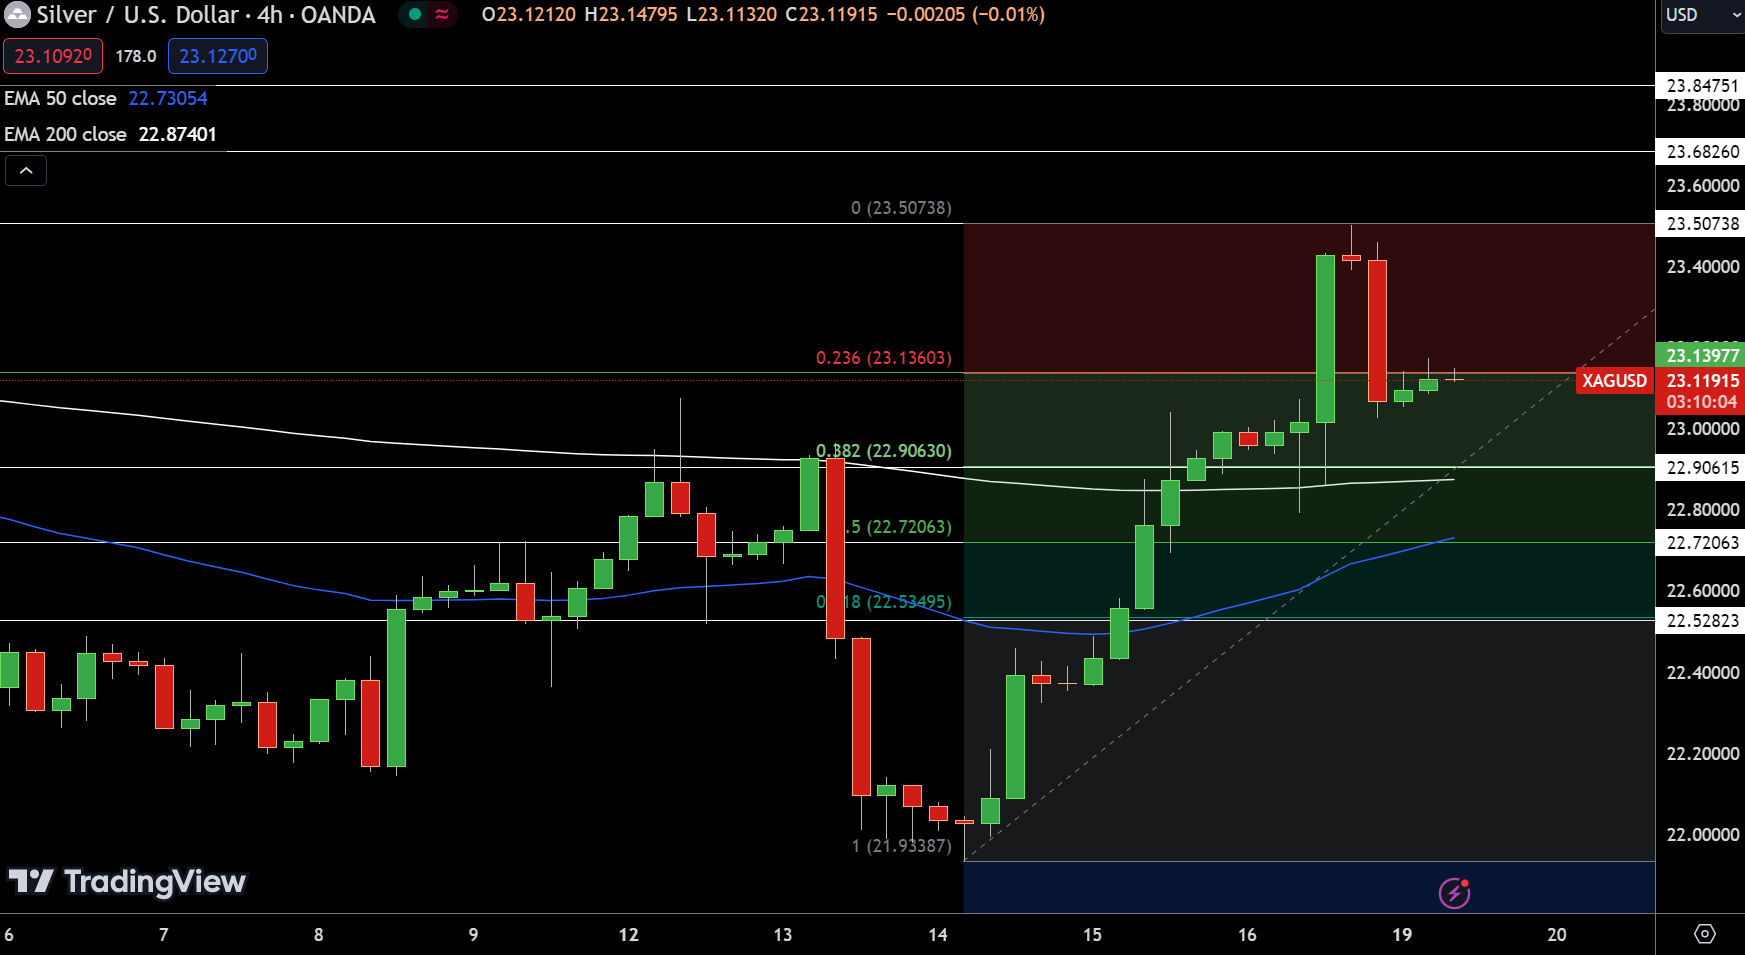
In the latest trading session, silver experienced a decrease, dropping by 1.27% to $23.11. This movement places the metal just below its pivot point of $23.14, suggesting a cautious market sentiment.
Resistance levels are identified at $23.51, $23.68, and $23.85, which silver must surpass to regain momentum. Conversely, support levels are established at $22.91, followed closely by $22.72 and $22.53, marking crucial zones for potential rebounds.
The 50-Day and 200-Day Exponential Moving Averages, at $22.73 and $22.87 respectively, hint at underlying strength. Despite the day’s loss, silver shows signs of bullish potential if it can sustain above the $22.91 mark, indicating a possible shift towards recovery in the near term.
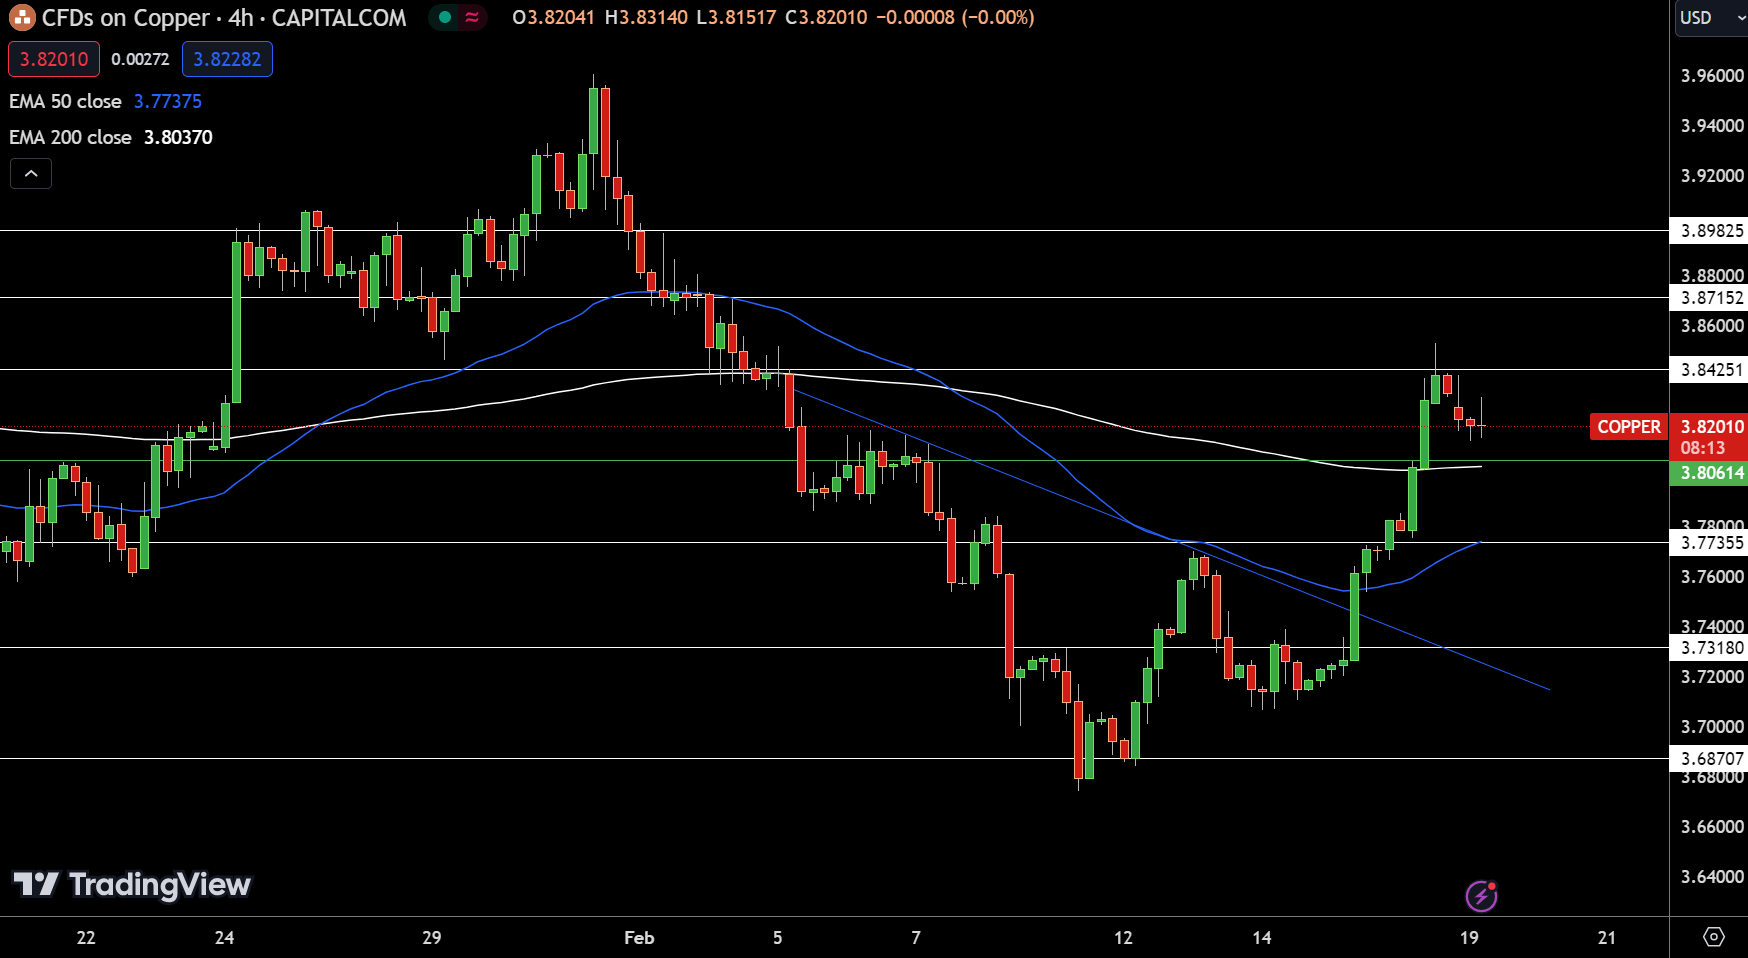
Copper‘s price dipped by 0.30% in the latest session, landing at $3.82, closely hovering around its pivot point of $3.81. Despite this minor setback, the metal showcases resilience with immediate resistance levels awaiting at $3.84, $3.87, and $3.90.
Support levels are drawn at $3.77, $3.73, and $3.69, suggesting potential zones where buyers might re-enter. The 50-Day and 200-Day Exponential Moving Averages, positioned at $3.77 and $3.80 respectively, indicate a market that leans slightly bullish.
Copper’s stance remains optimistic above the $3.81 mark, suggesting a positive outlook if it maintains above this threshold.