
Additionally, a generally positive risk tone may cap the safe-haven demand for Gold. Robust follow-through buying is needed to confirm that the recent decline from the all-time peak has ended.
US Dollar Dip-Buying and Inflation Data
The US Dollar saw some dip-buying on Tuesday, creating headwinds for Gold. Despite this, expectations for two rate cuts by the Fed in 2024 temper any significant slide.
The Fed’s projection of a single rate cut this year, compared to three in March, helped US bond yields recover and the USD regain traction. Philadelphia Fed President Patrick Harker’s comments on maintaining current rates to control inflation further pressured Gold.
Economic Indicators and Fed Speeches
Data released on Friday showed US import prices fell for the first time in five months in May. Combined with weaker US consumer and producer prices, this indicates subsiding inflation, keeping hopes for Fed rate cuts alive.
Investors are now focused on Tuesday’s US economic releases, including Retail Sales and Industrial Production data, for short-term trading opportunities. Additionally, speeches by several influential FOMC members are expected to impact USD demand and, consequently, Gold prices.
Short-Term Forecast
Gold (XAU/USD) faces resistance at $2,325.62. A breakout above this level may trigger bullish momentum. Immediate support is $2,310.85; a drop below could indicate further declines.
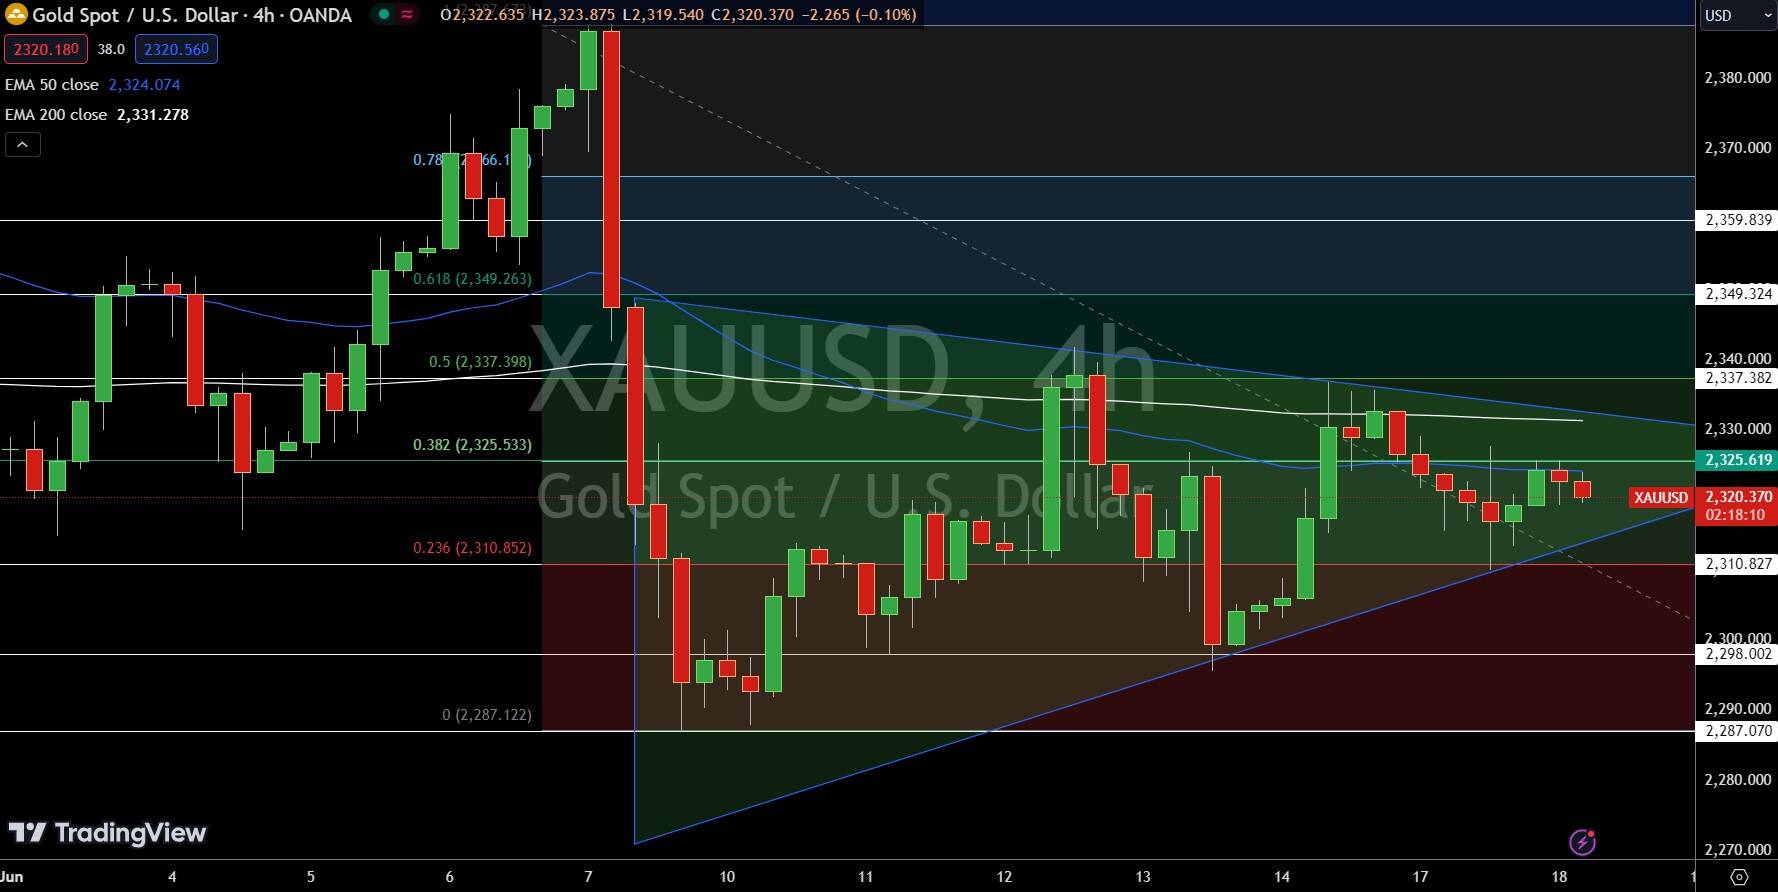
Gold – Chart
On the downside, immediate support is found at $2,310.85. If this level is broken, the next support levels are at $2,298.00 and $2,287.12. The 50-day Exponential Moving Average (EMA) at $2,324.07 and the 200-day EMA at $2,331.28 are also significant indicators to watch, as they provide additional layers of support and resistance.
The Fibonacci retracement levels further highlight key areas of interest. A break above the pivot point of $2,325.62 could indicate a bullish move, while a drop below $2,310.85 may suggest further downside pressure.