Gold Confirms Breakout, Faces First Pullback Test
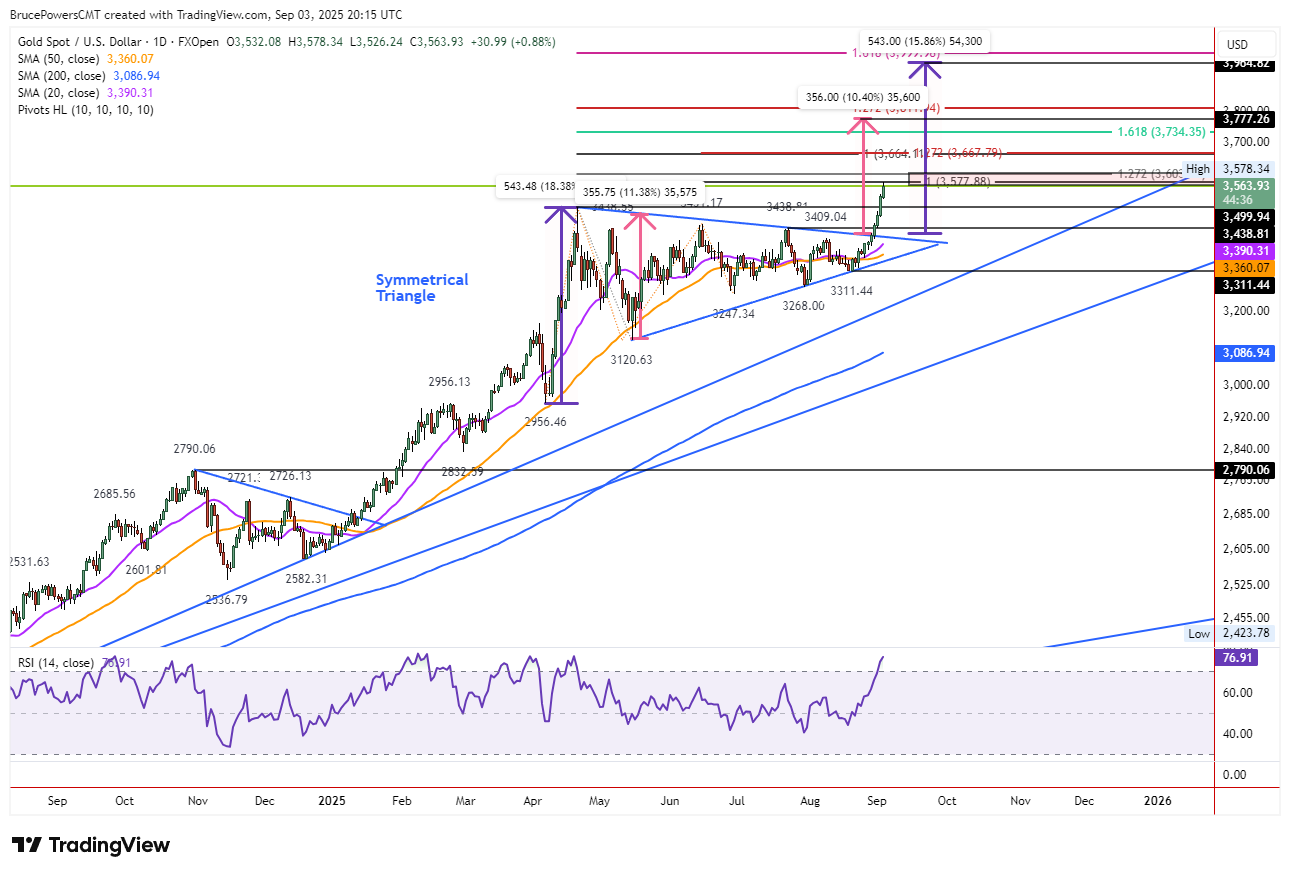
Gold rallied to a new record high of $3,578 on Wednesday before meeting resistance. That level completed a 100% projection for a rising ABCD pattern within the recent symmetrical triangle consolidation. Importantly, Tuesday’s close above the prior record high of $3,500 confirmed a long-term bull trend continuation. This shows strong underlying demand, though the next pullback will be crucial in revealing how supply and demand dynamics may shift.
Short-Term Extension Risks
An initial higher target lies at $3,603, the 127.2% Fibonacci extension of the recent bearish correction. Gold has advanced for ten consecutive sessions since the August 20 reversal, raising the possibility of a short-term overbought condition. Sustaining momentum at record levels may become difficult, making consolidation or a pullback increasingly likely before higher targets are pursued.
Long-Term Upside Objectives
Despite near-term exhaustion risks, the technical backdrop remains clearly bullish. The symmetrical triangle’s measuring objective suggests a potential move toward $3,779, while the prior measured upswing points toward $3,966. Each was calculated based on the change in price, reinforcing the case for further upside eventually.
Key Support Levels
Should a pullback develop, potential support rests first at the $3,500 breakout level. Additional support zones include the prior swing highs between $3,451 and $3,409. Holding above these levels would signal healthy consolidation within a still-intact bull trend.
Outlook
While speculation about short covering may explain part of the rally, the breakout stands on its own strength. Typically, the first pullback following a major breakout offers an important test of demand and often sets up the next leg higher.
Gold Price Forecast
Every new Gold analysis as it publishes, today's technical signal and key levels, live price — on one page.
See all Gold forecastsFor a look at all of today’s economic events, check out our economic calendar.