


Support Holds as Buyers Return
Gold showed signs of a bullish trend reversal on Friday as it rallied above a lower swing high at $4,589 to reach a 10-day high of $4,595. That high successfully tested resistance near the 20-day moving average at $4,586. This is bullish behavior that suggests the bearish correction may be approaching completion as buyers begin to regain control.
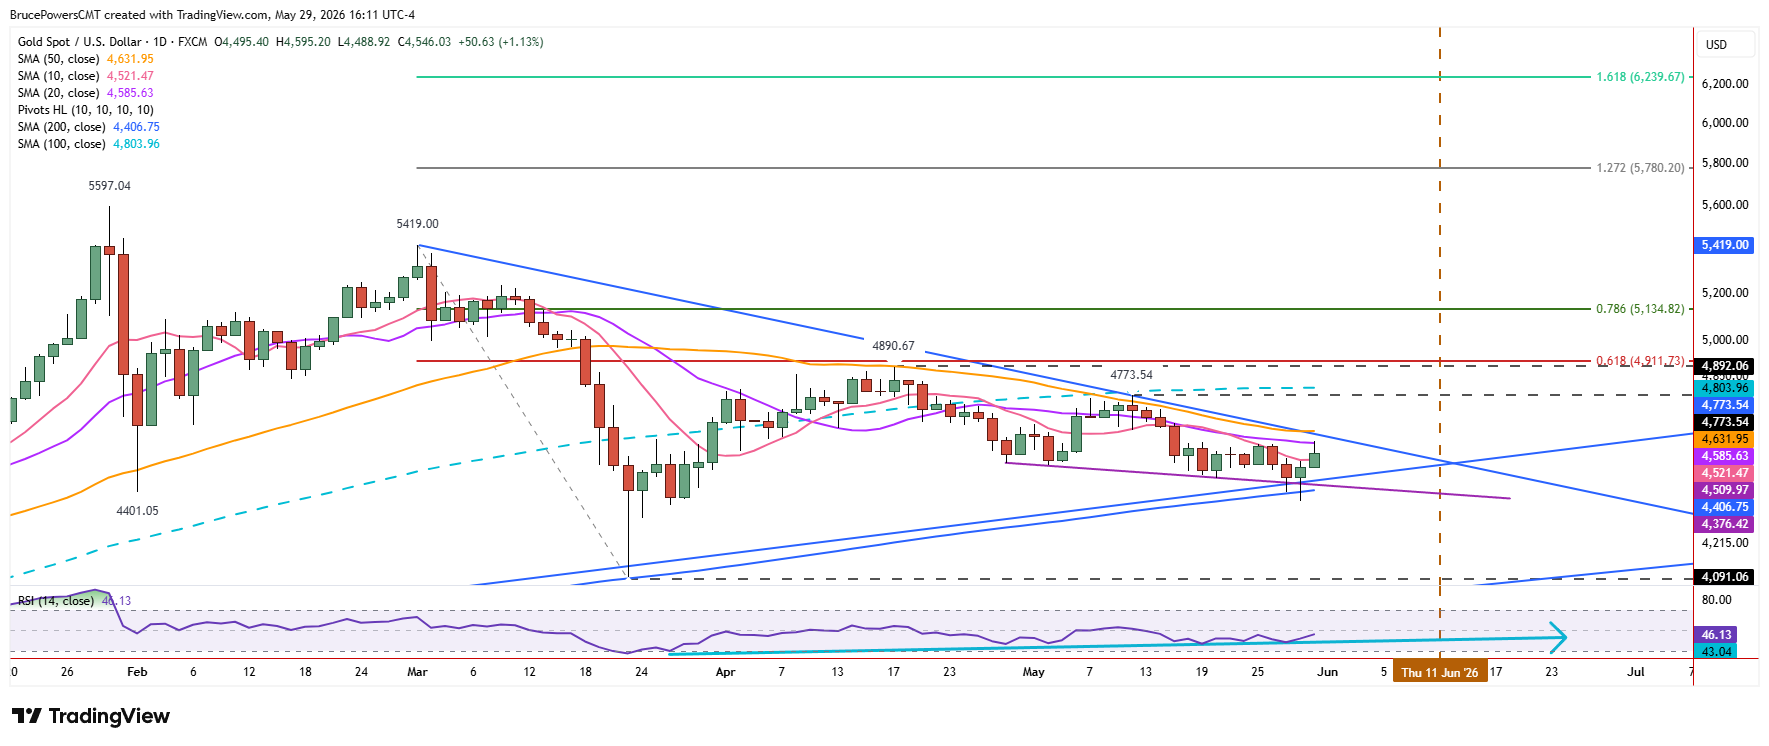
Following the successful test of a long-term support zone near the 200-day moving average earlier this week, buyers returned more aggressively. A bullish hammer candlestick pattern formed on Thursday, and a one-day bullish reversal triggered Friday, leading to a rally and a successful test of dynamic resistance near the 20-day average.

50-Day Average Becomes Key Battleground
The possibility of a bullish reversal within the broader declining trend structure is increasing as key trend resistance near the 50-day moving average at $4,632 comes into view. A decisive advance above that indicator would also confirm a breakout above the downtrend line. Since the 50-day average acted as resistance during the last two upswings, a breakout would show a change in character, suggesting that a new bullish leg higher has begun.
Falling Wedge Hints at Momentum Shift
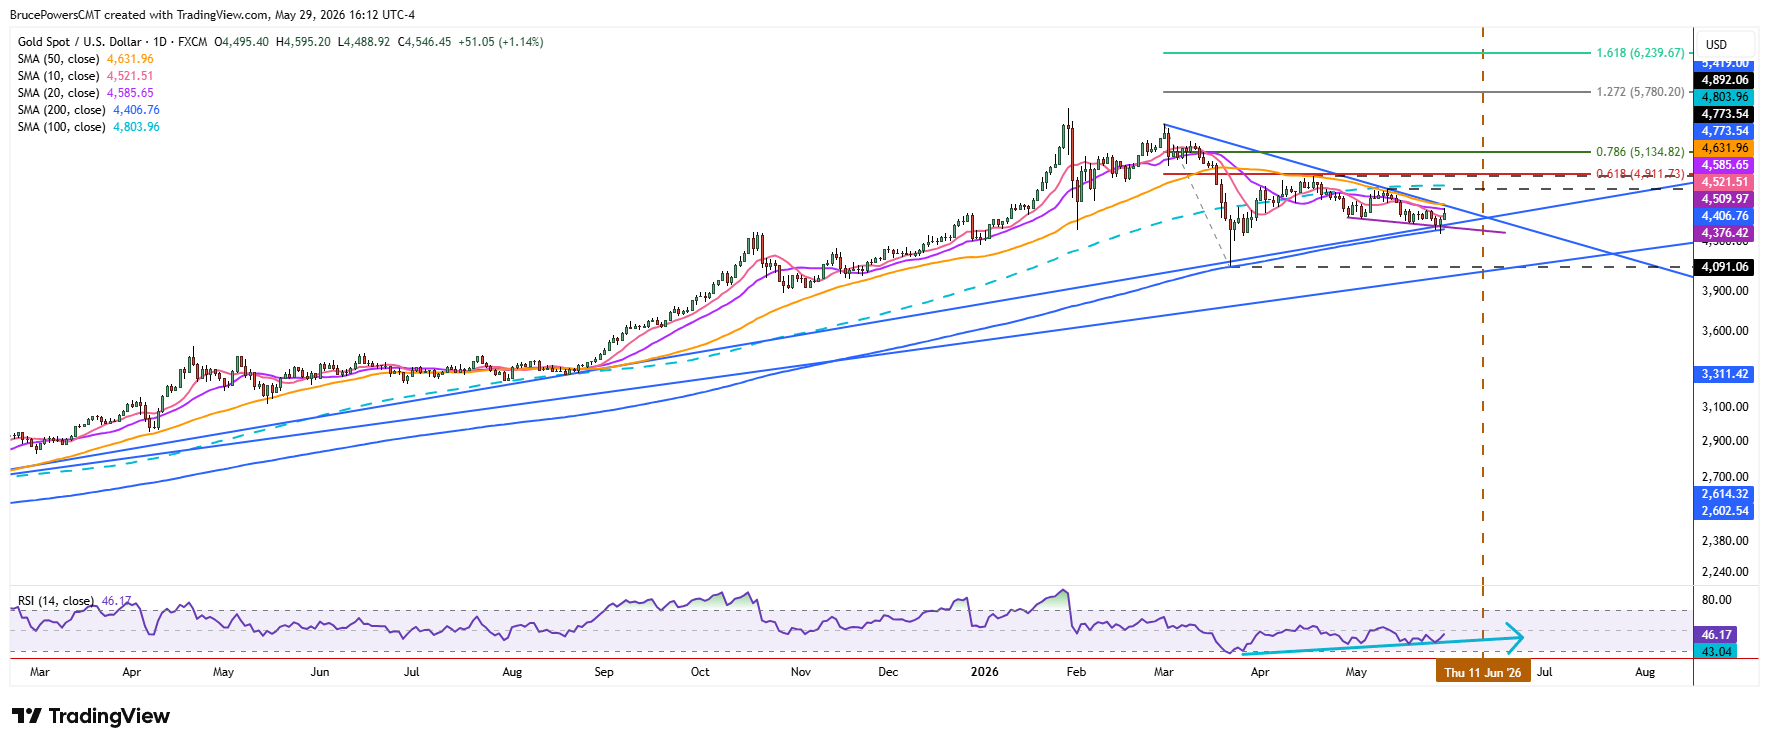
Price has been coiling in a downward sloping consolidation recently that takes the form of a bullish falling wedge. As the pattern develops, energy typically builds until a decisive breakout occurs, at which point bullish momentum often strengthens noticeably. Friday’s advance established a higher swing low, which reflects improving underlying demand and reinforcing the developing bullish reversal theme introduced earlier.
Upside Levels to Watch
There are two initial upside targets following a confirmed reclaim of the 50-day average. Initially, there is an area of confluence from $4,774 to approximately $4,805, with the top level coming from the 100-day moving average. Although a rally above the lower trend high that begins the range will signal a reversal of the short downtrend, a more significant bullish recovery would be indicated above the lower swing high of $4,891, which represents a more important resistance level within the broader bearish trend structure.
If you’d like to know more about how to trade gold and silver, please visit our educational area.



