Spot Gold Extends the Reversal as Ceasefire and Dollar Do the Work
Spot Gold (XAUUSD) is up more than 1% Friday and trading on the strong side of $4,481.78 late in the session. Thursday’s buyers showed up at the 200-day moving average and Friday’s follow-through confirmed they meant it.
The 60-day ceasefire framework between the United States and Iran pulled crude oil lower for a third straight day. The U.S. Dollar Index dropped toward 99 and is heading for a weekly decline of roughly 0.3%. Lower oil takes inflation pressure off.
A weaker dollar makes gold cheaper for every foreign buyer on the board. Both of those forces hit at the same time and the metal responded.

The Ceasefire Is Running the Rate Chain in Reverse
The gold specific rule has been running one direction for months. War pushed oil higher, oil pushed inflation higher, inflation kept the Federal Reserve locked in restrictive territory, and gold paid the price. Friday that chain reversed. The ceasefire framework between Washington and Tehran includes provisions to lift shipping restrictions through the Strait of Hormuz.
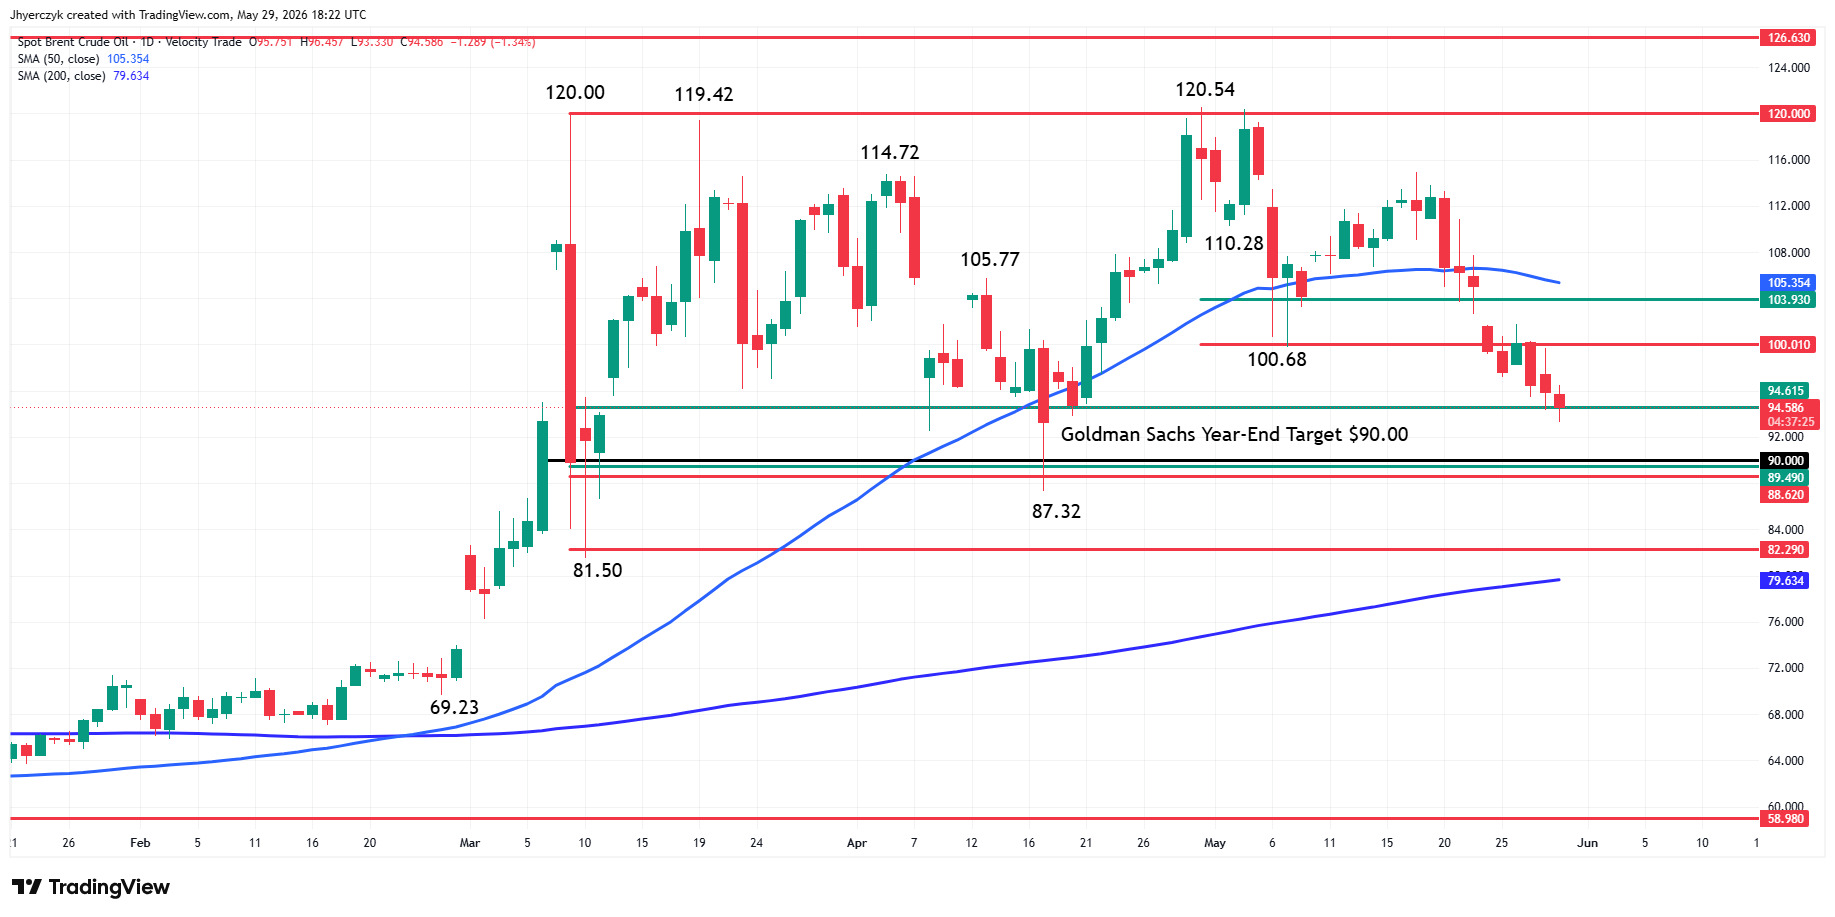
Spot Brent crude oil dropped for a third straight session and is heading for a weekly loss of more than 8%. That kind of decline in energy prices feeds directly into inflation expectations. Lower oil means lower input costs across the economy. Lower input costs mean the Federal Reserve has less reason to keep rates elevated indefinitely.
The U.S. Dollar Index traded near 99 and snapped a two-week winning streak. During the early stages of the conflict the dollar attracted strong demand because the United States was seen as less exposed to imported energy inflation. That trade is unwinding now. Ceasefire progress pulls capital out of defensive dollar positions and gold picks up the flow on the other side.
Spot Gold (XAUUSD) Technical Analysis
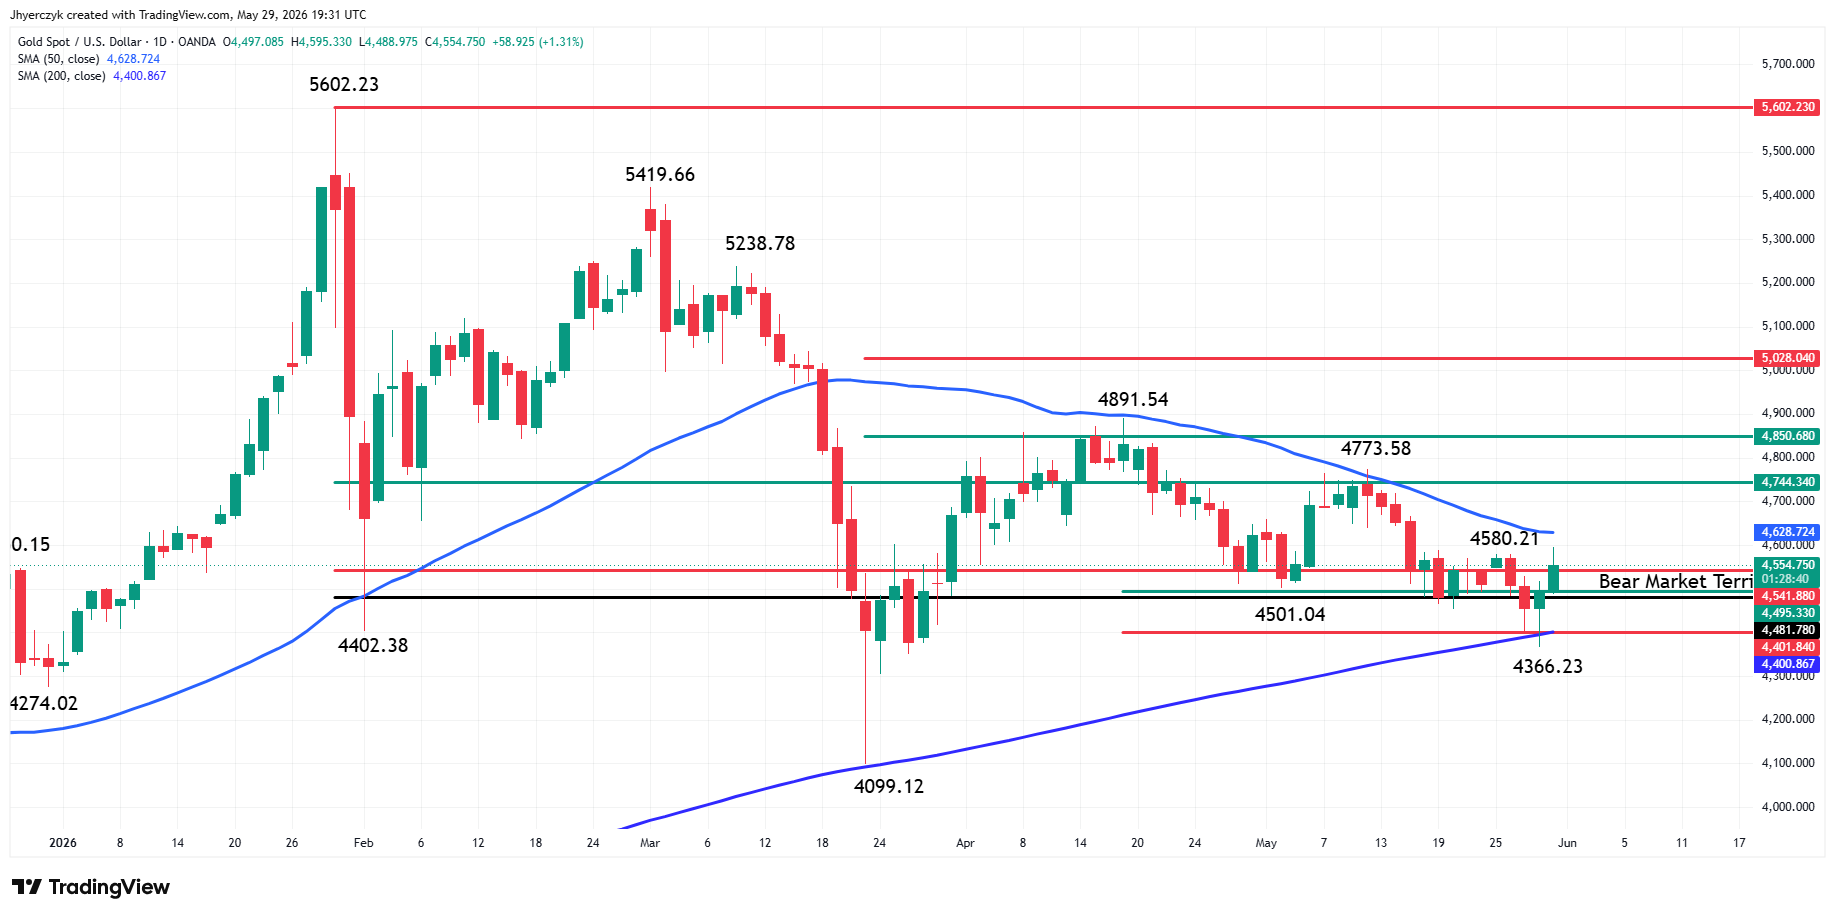
Spot Gold (XAUUSD) is trading higher late in the session on Friday. Buyers came in strong the previous session when the market dropped to $4,366.23. This was slightly below the support cluster formed by a short-term retracement level at $4,401.84 and the long-term 200-day moving average at $4,400.86. This is a significant development because it explains the reason for the recent consolidation, traders were looking for value.
Gold Price Forecast
Every new Gold analysis as it publishes, today's technical signal and key levels, live price — on one page.
See all Gold forecastsPrices accelerated on Friday after buyers recaptured $4,481.78. This put the market on the strong side of the line that separates the bulls from the bears. After spending two days on the bear side, the market has flipped back to the bull side.
But the technical bounce from the 200-day MA and the recapturing of the Bull/Bear line is not enough to declare the bottom is in or to announce the start of a new bull market. Buyers have to still overtake the 50-day MA at $4,628.68. Overtaking this level will indicate that traders are willing to take out offers and buy strength. That will mark the start of a different kind of rally. Instead of buying dips and value, traders may now be interested in buy strength and trading momentum.
Why Is Inflation Still a Problem for Gold?
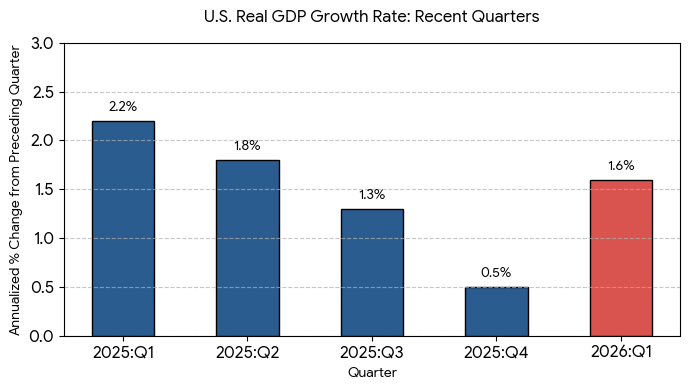
The rate chain reversed on Friday but the destination has not changed yet. U.S. inflation accelerated in April at the fastest pace in three years. Most of that increase tied directly to higher energy costs during the Iran conflict. The Federal Reserve is not cutting rates off one good week of oil prices. The April Personal Consumption Expenditures index held at 3.8% year-over-year. That is nearly double the Fed’s 2% target. The ceasefire gave gold breathing room. It did not give the Fed a reason to move.
Higher rates keep the opportunity cost of holding Spot Gold (XAUUSD) elevated. Bonds are paying attractive yields. Gold pays nothing. That math has not changed even though the geopolitical backdrop improved. The rally holds as long as the ceasefire progress continues pushing oil lower and weakening the dollar. It stalls the moment the rate conversation takes over again.
Physical Demand Is Not Helping
India is not buying. Elevated local prices and import duties are keeping physical buyers on the sideline. China is pulling back too. Local premiums have narrowed and consumers are waiting for lower prices before stepping in. Those are the two largest physical gold markets in the world.
When both of them go quiet at the same time, the floor underneath Spot Gold (XAUUSD) gets thinner. The metal is trading on the rate chain and the dollar right now. Nothing else. One shift in Federal Reserve expectations or one reversal in the ceasefire headlines and there is no physical bid to catch it.
Does the 50-Day Moving Average Break Next Week?
The ceasefire framework is pulling oil lower, the dollar is weakening, and the rate chain is working in gold’s favor for the first time in weeks. Thursday’s reversal off the 200-day moving average at $4,400.86 was the value buyers showing up where they needed to show up. Friday’s follow-through above $4,481.78 confirmed it. But confirmation and a new bull run are two different things.
The 50-day moving average at $4,628.68 is the line that separates a bounce from a breakout. Below it this is still a buy-the-dip trade inside a broader correction. Above it and traders shift from buying value to buying momentum and that is a different kind of rally entirely. The ceasefire has to hold. Oil has to keep falling. The dollar has to stay weak.
All three of those conditions are in place heading into the weekend. One headline from Tehran or one hot inflation print reverses all of them. For now the rate chain favors gold but the Fed has not moved and until it does the 50-day MA is a ceiling, not a floor.
If you’d like to know more about how to trade gold, please visit our educational area.