
Bitcoin (BTC) price plunged 3.36% on Tuesday to around $89,250, its worst level in seven months. When measured from its record high of around $126,200, the cryptocurrency is down about 30%, prompting some analysts to see broader declines in the future.
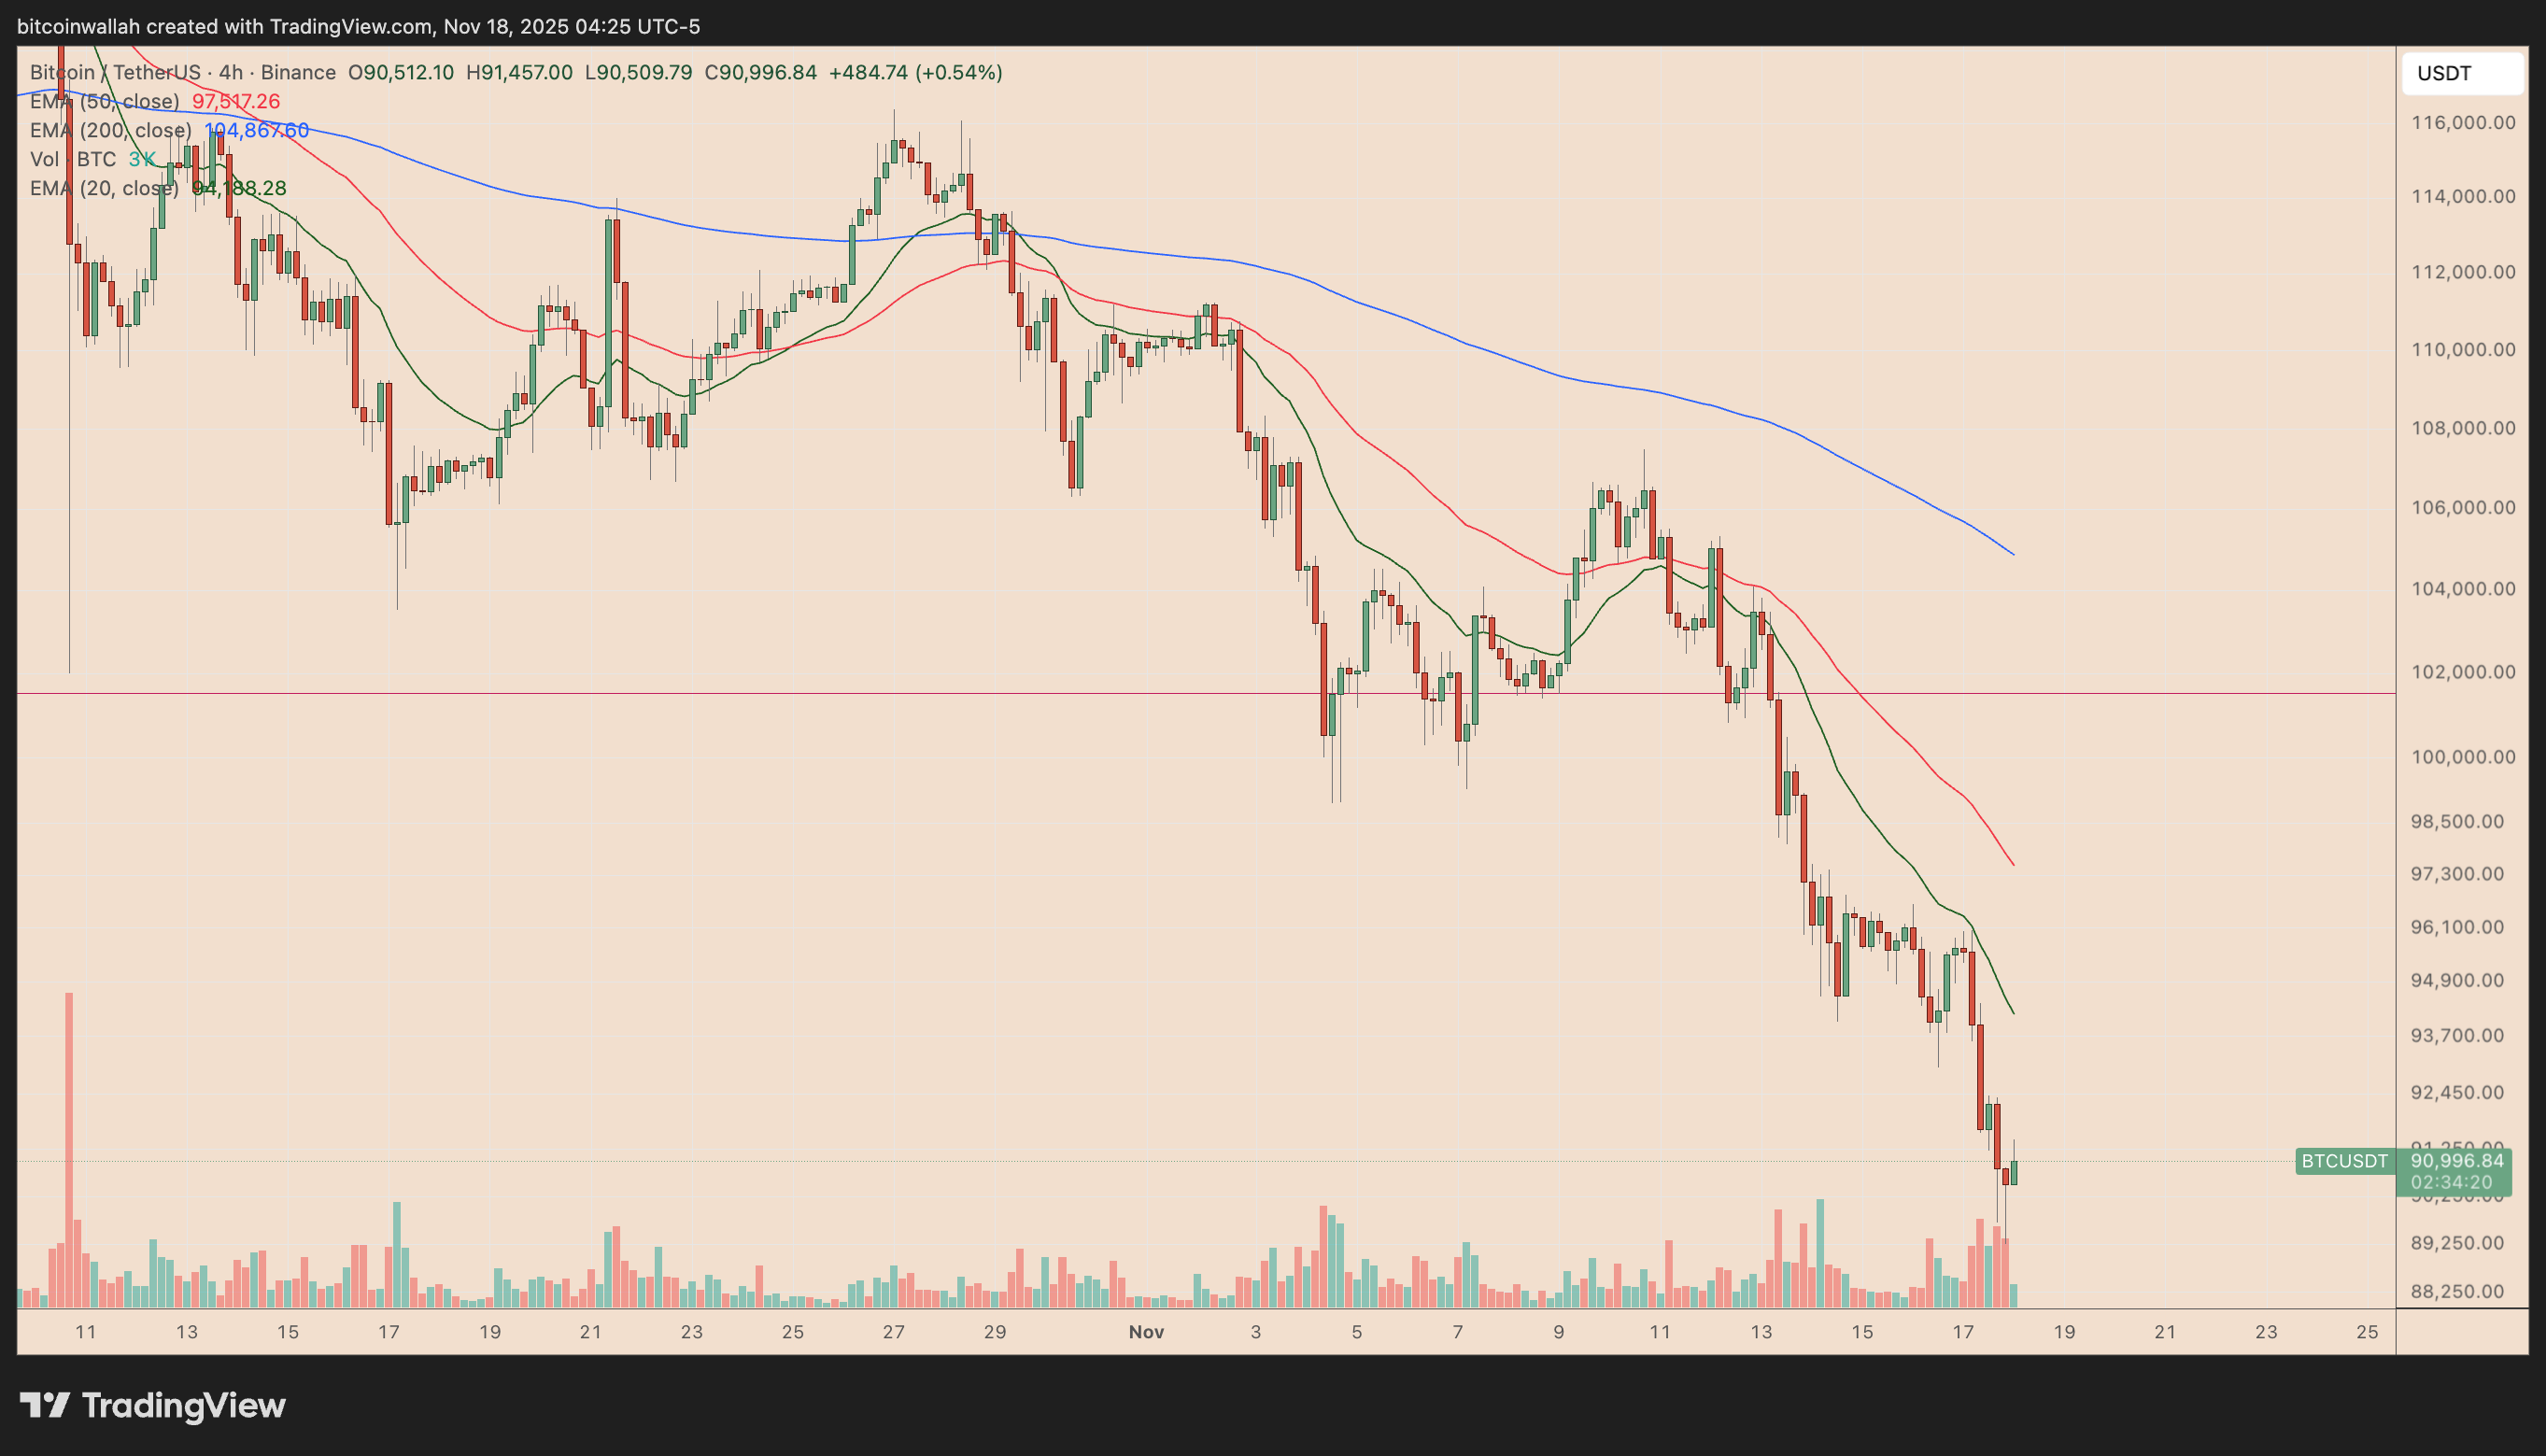
How low can the Bitcoin price go? Let’s examine.

Bitcoin On-Chain Metric Hints at $82,000
Bitcoin is now wrestling with some of its most important on-chain support zones of the cycle, according to Joao Wedson, founder and CEO of data resource Alphractal.
The first line of defense sits at the Active Realized Price (~$89,400), a cost basis cluster representing active market participants.
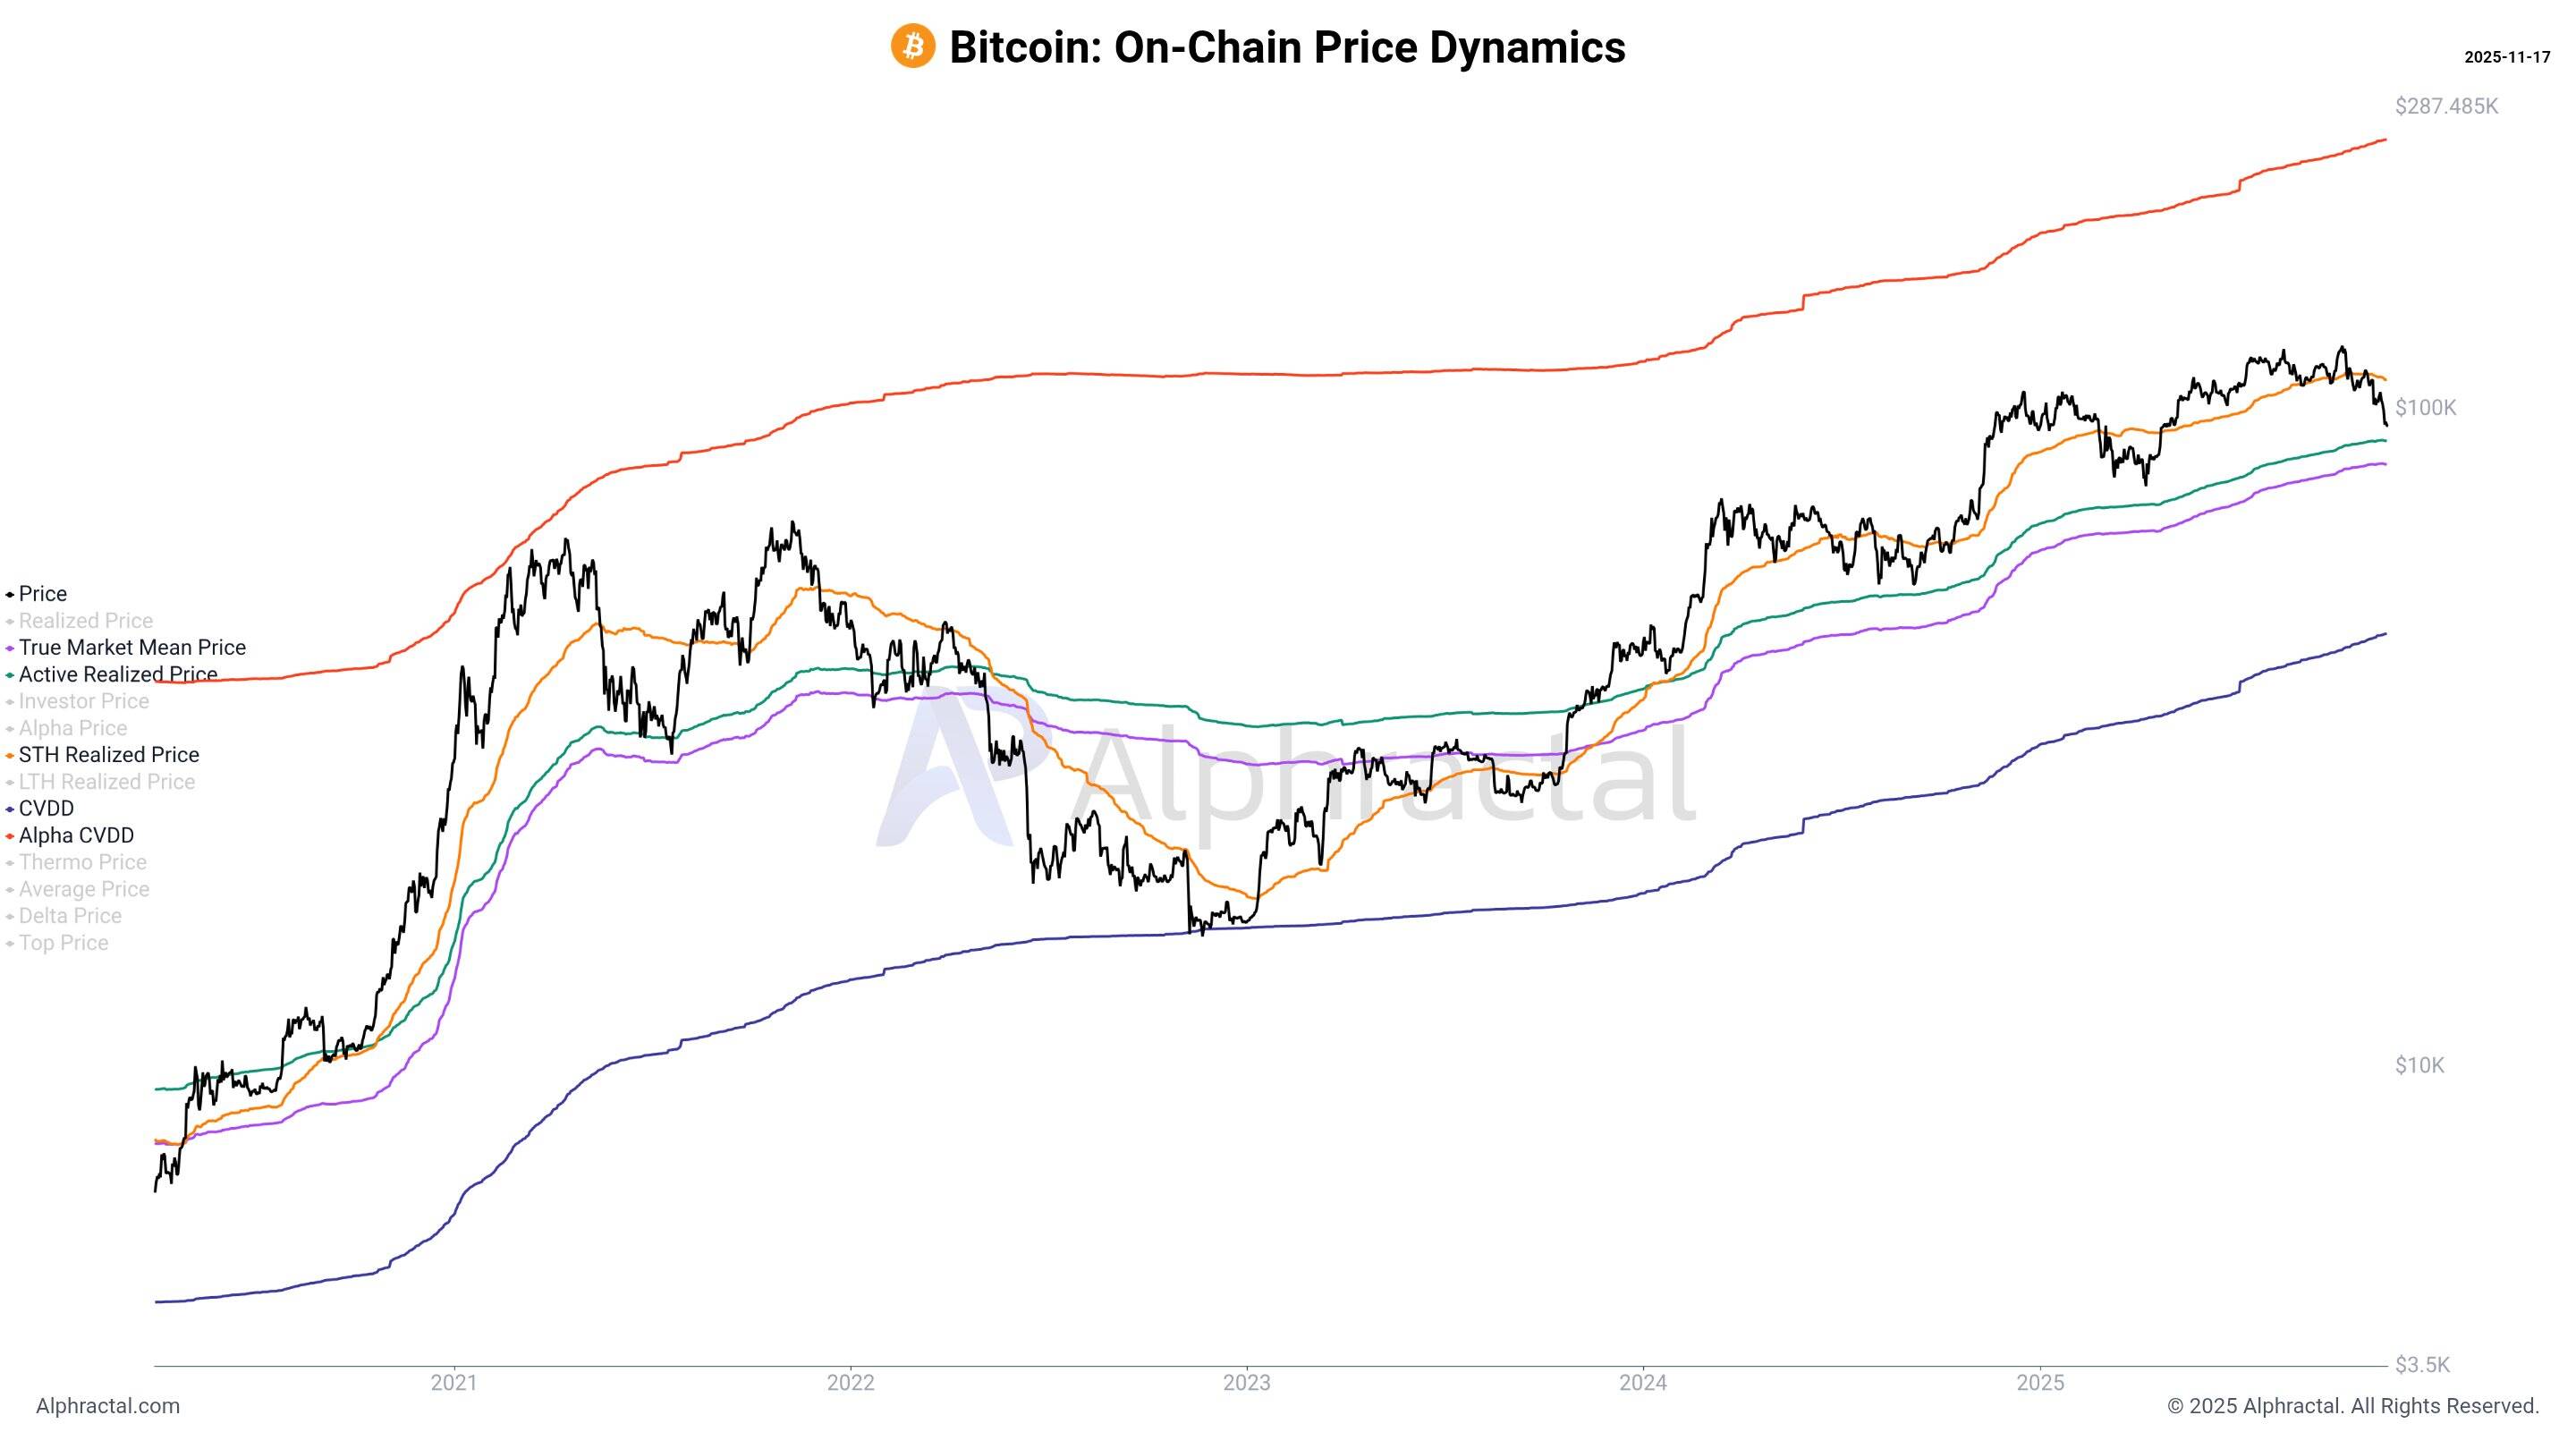
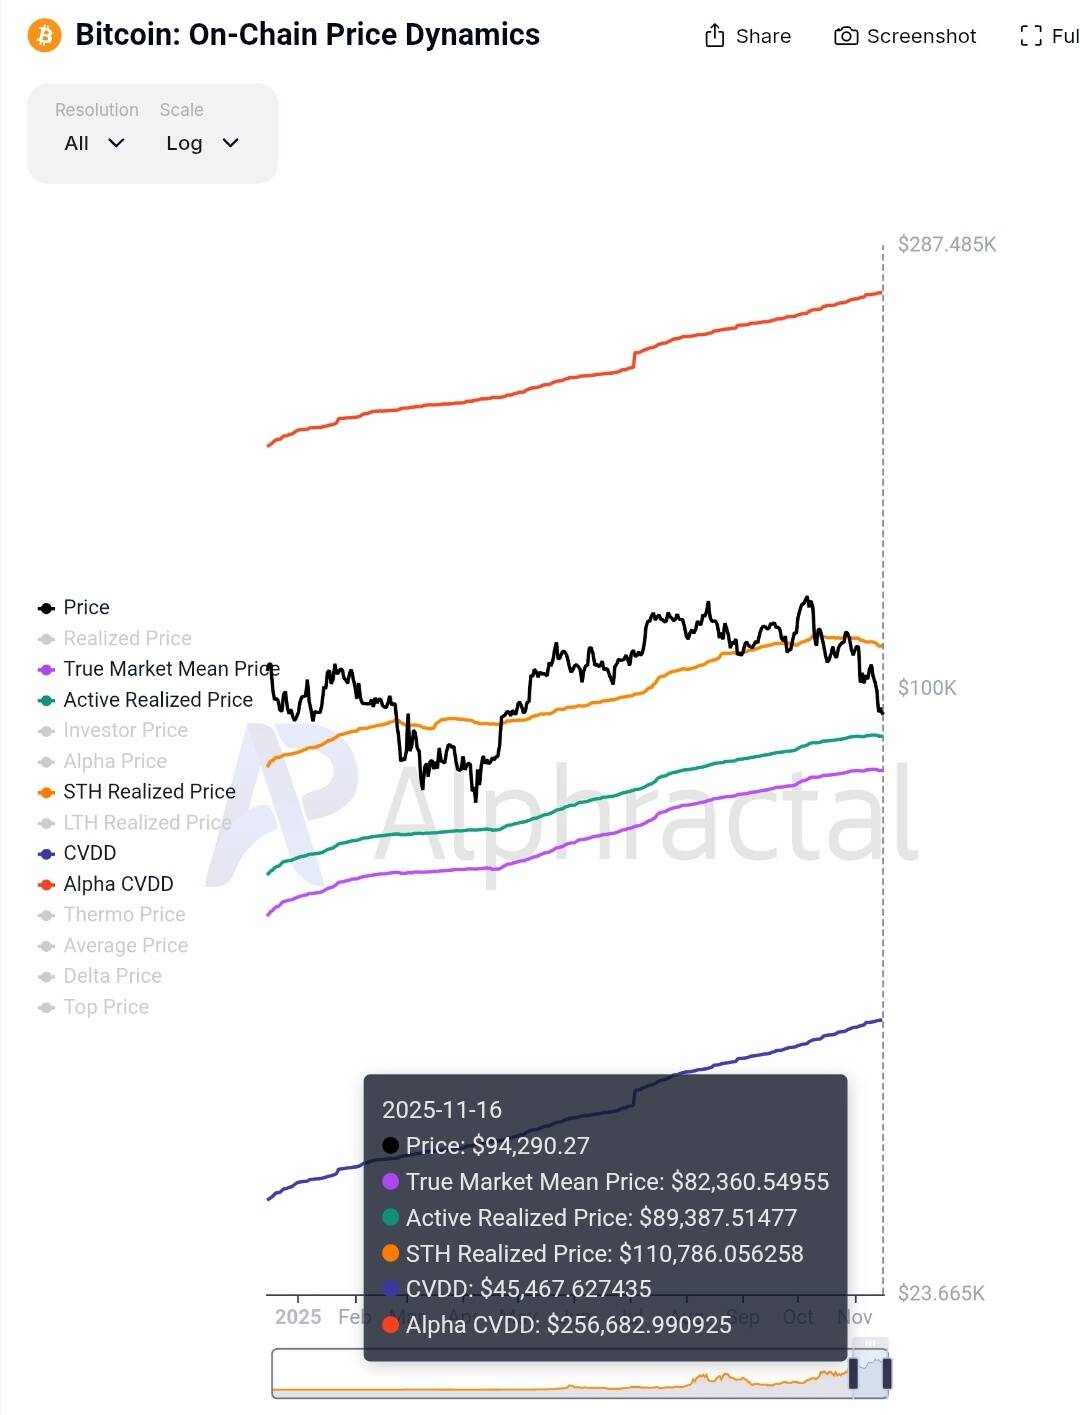
But Wedson warns that today’s structure is “far weaker,” given elevated long-term holder distribution and the sharp macro unwind over the past two weeks.
For risk-tolerant traders, Wedson sees “scalpel-like opportunities” between $89,000–88,000, and again near $82,000.
Bitcoin Price Forecast
Every new Bitcoin analysis as it publishes, today's technical signal and key levels, live price — on one page.
See all Bitcoin forecasts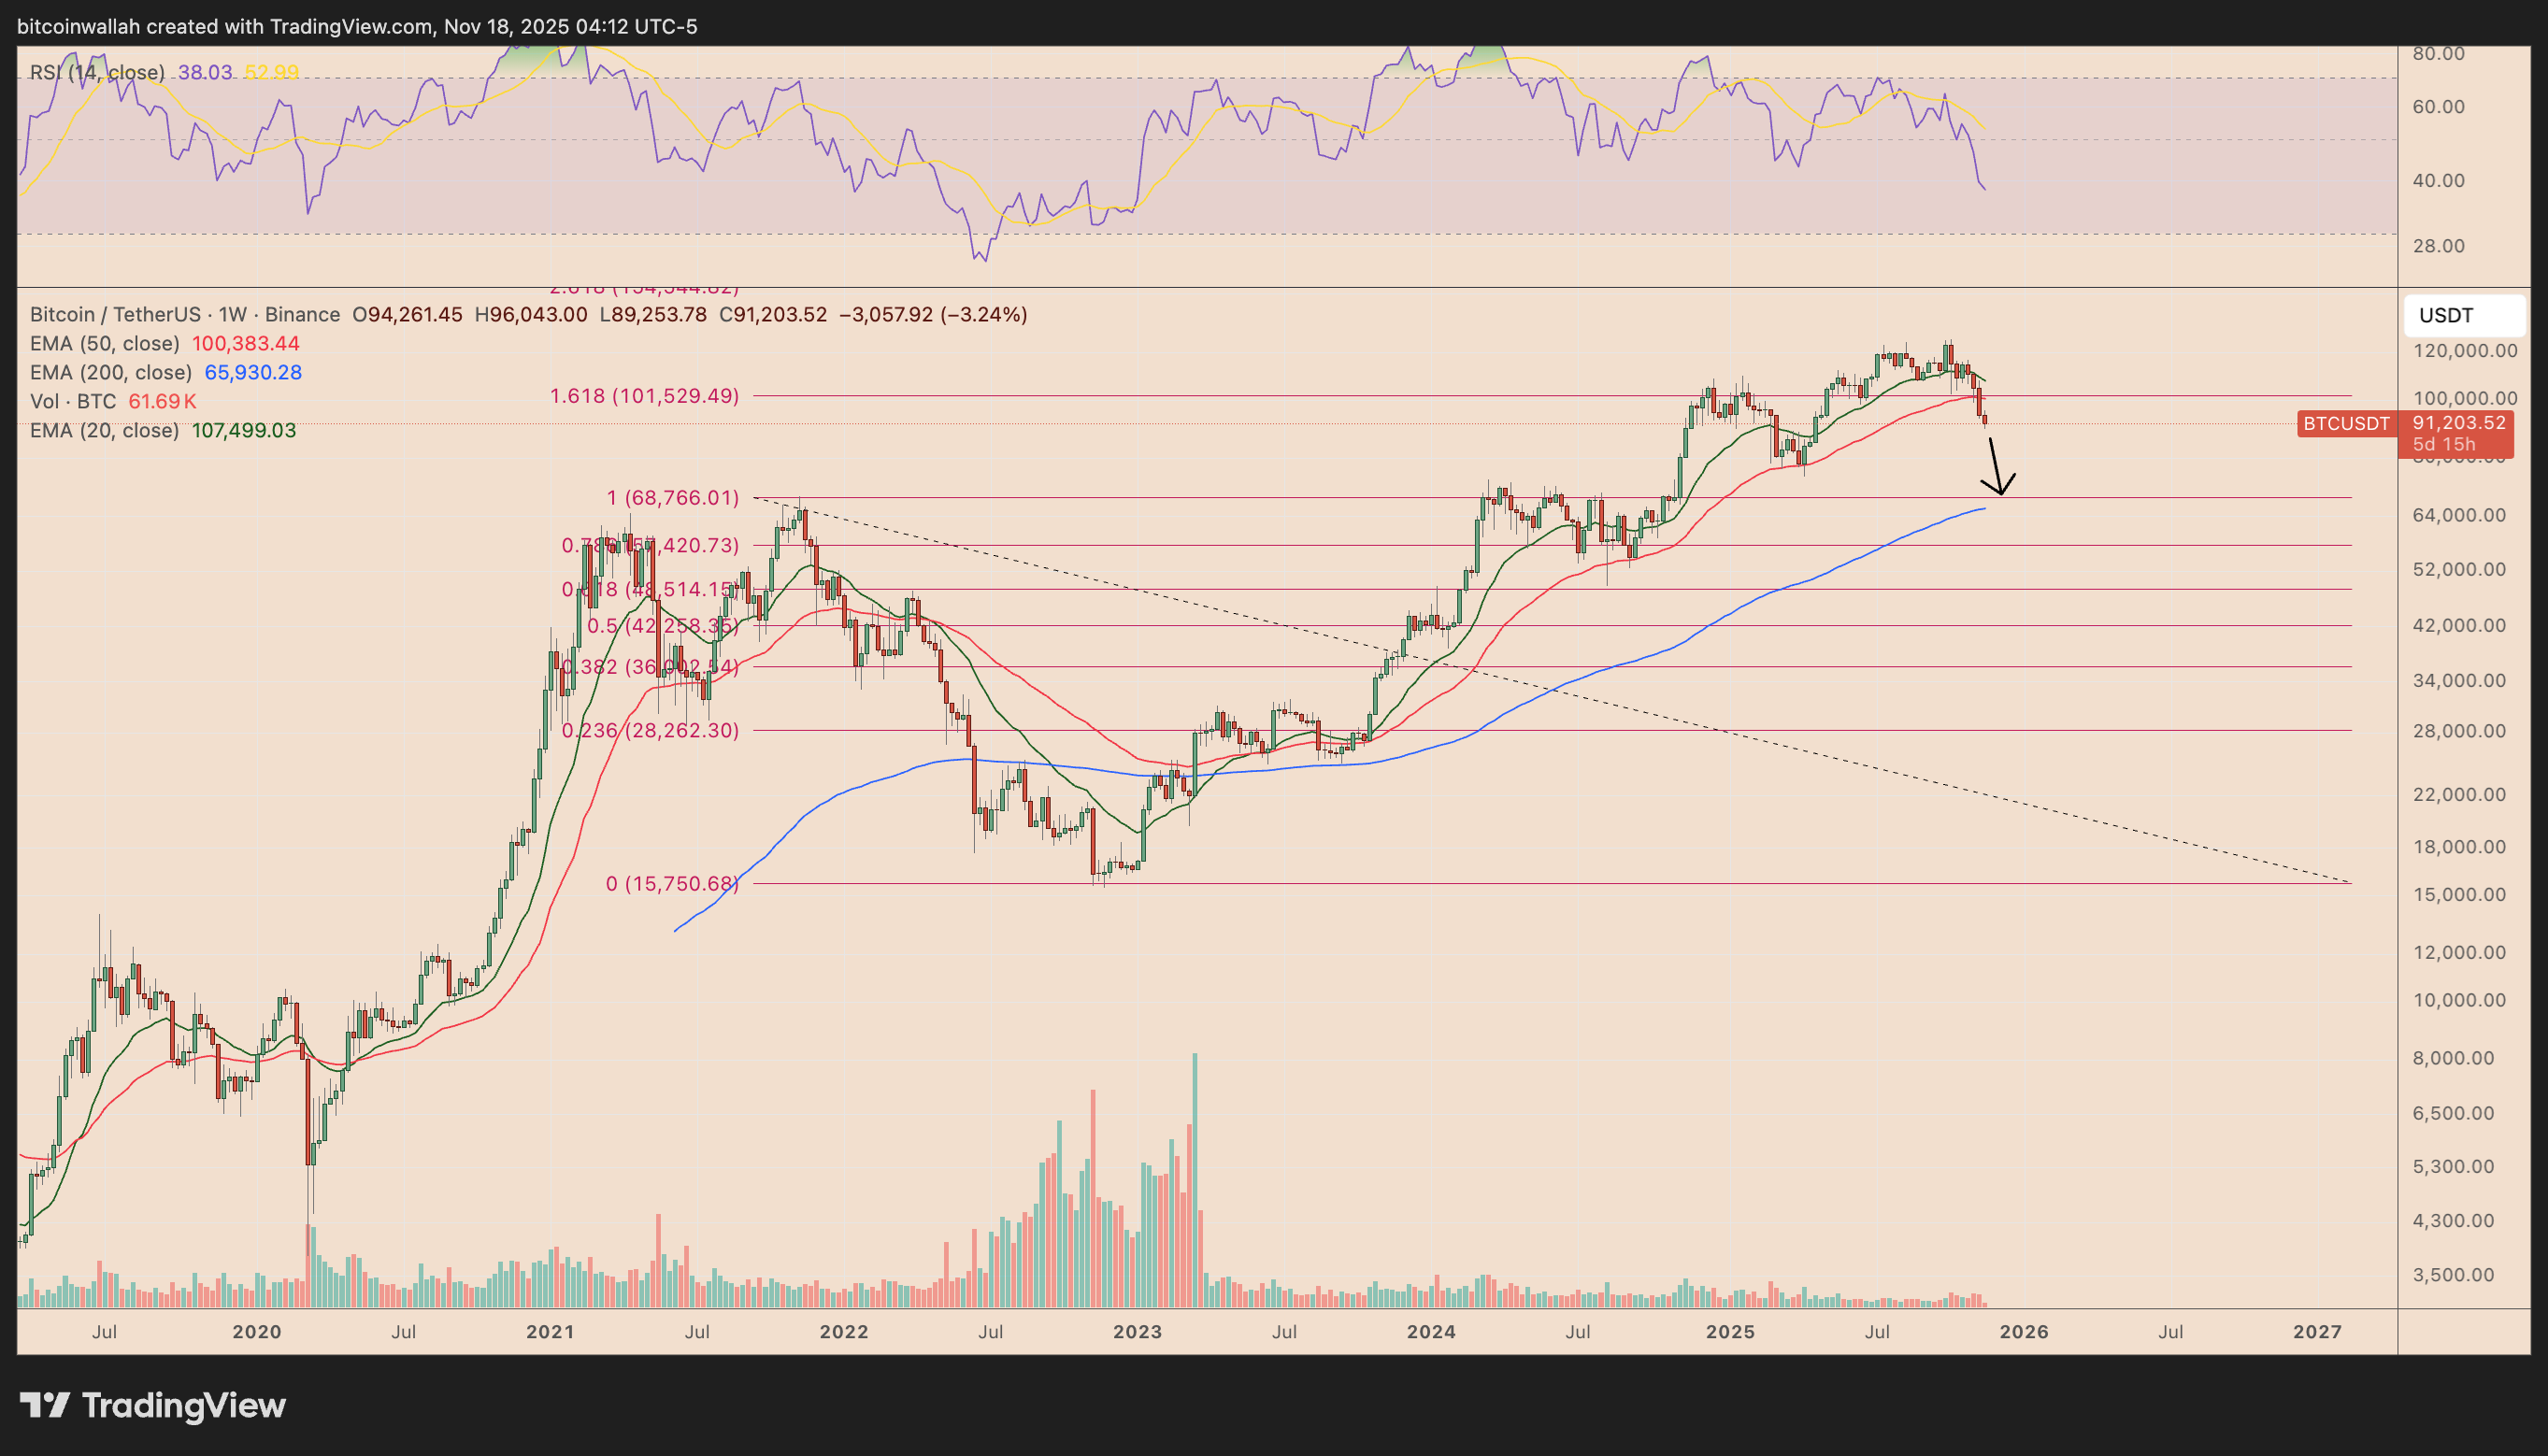
The drop also sliced through the 1.618 Fibonacci extension (~$101,500), a level that acted as a springboard during previous bull cycles but is now behaving as resistance.
With momentum firmly tilted downward and RSI slipping toward oversold territory, BTC’s next major magnet sits near the 1.0 Fib retracement around $68,700.
This region previously served as the macro breakout point in late 2024, making it a logical downside target if sellers maintain control.
BTC MVRV Metrics Points At $75,700
Bitcoin has also slipped beneath its MVRV Mean pricing band (~$98,600), a level that historically differentiates healthy bull trends from mid-cycle exhaustion.
According to Glassnode’s MVRV deviation structure, BTC had held above the mean since early 2023, using it as a dynamic support zone throughout the ETF-driven rally and the first half of 2025.
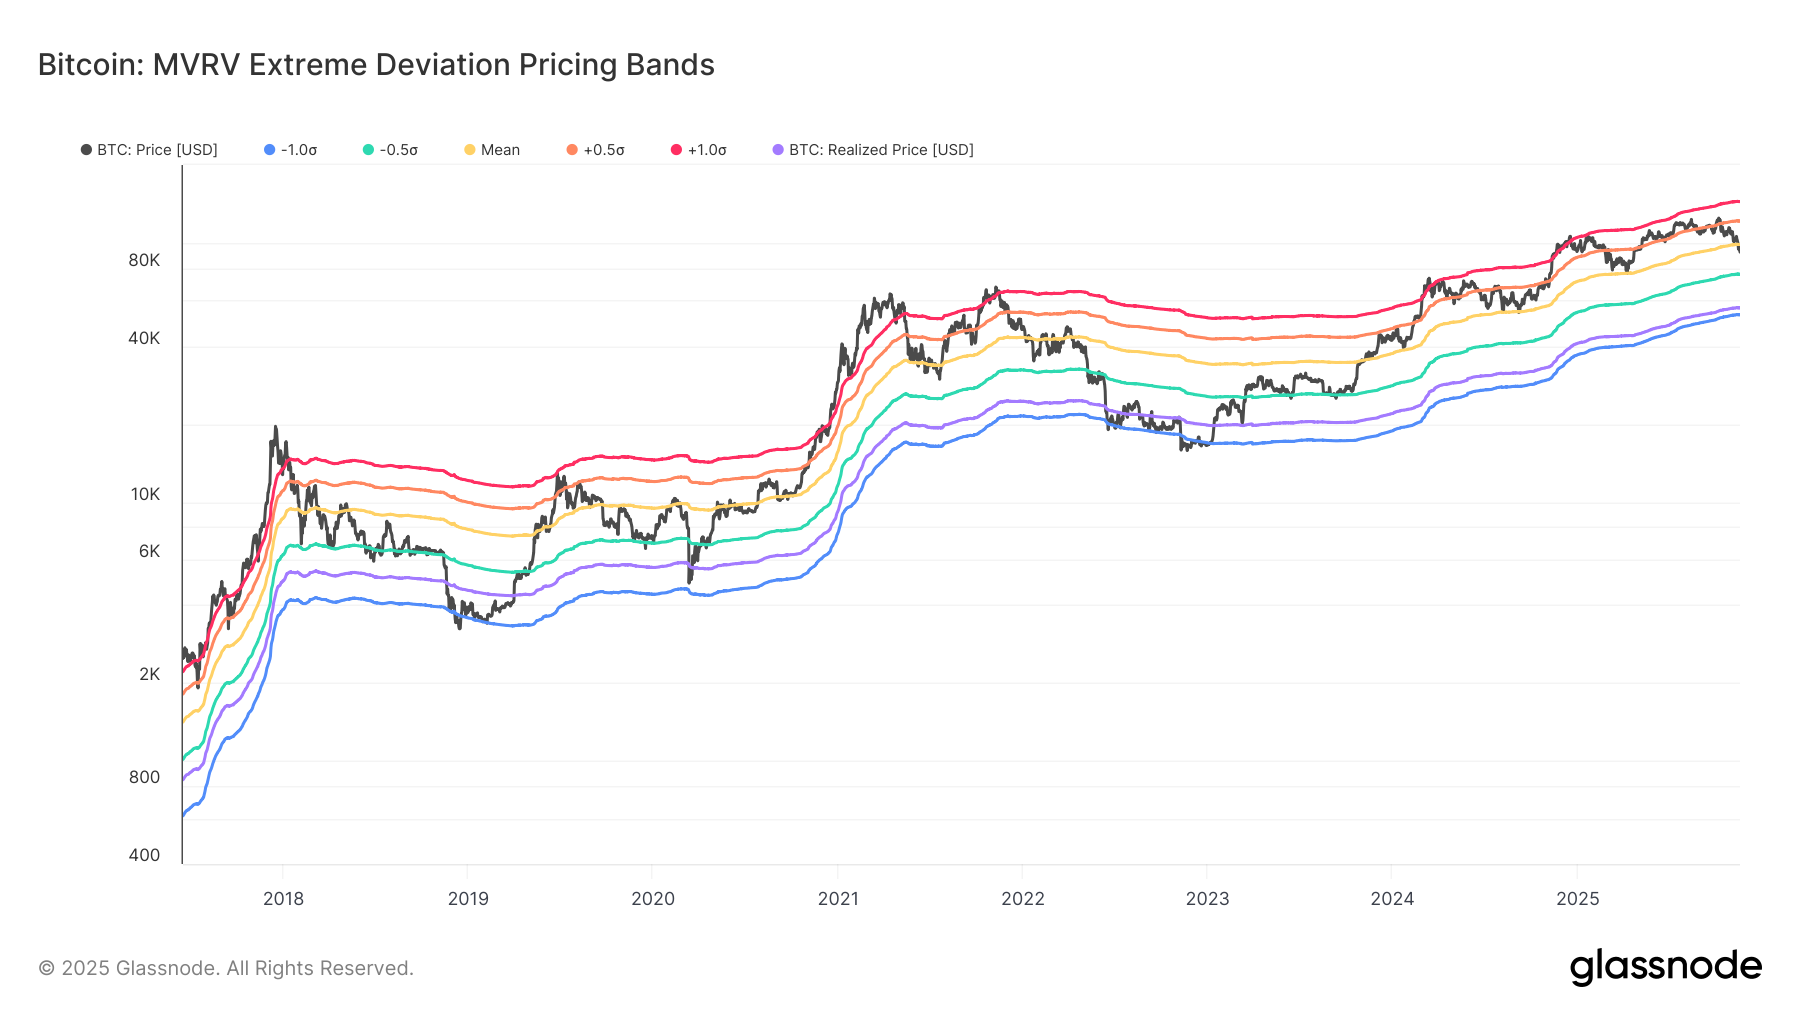
Losing this band for the first time in nearly three years signals a notable shift in market positioning: unrealized profits are compressing, seller pressure is rising, and risk-adjusted valuations are resetting.
The next logical destination sits at the -0.5σ band near $75,700, which has acted as a mid-cycle reaccumulation region in every bull market since 2017.
A deeper washout toward -1.0σ (~$52,800) cannot be ruled out if macro conditions worsen, but historically, revisits to lower bands have produced high-conviction long-term bottoms rather than full-scale trend reversals.