NASDAQ 100 Technical Analysis
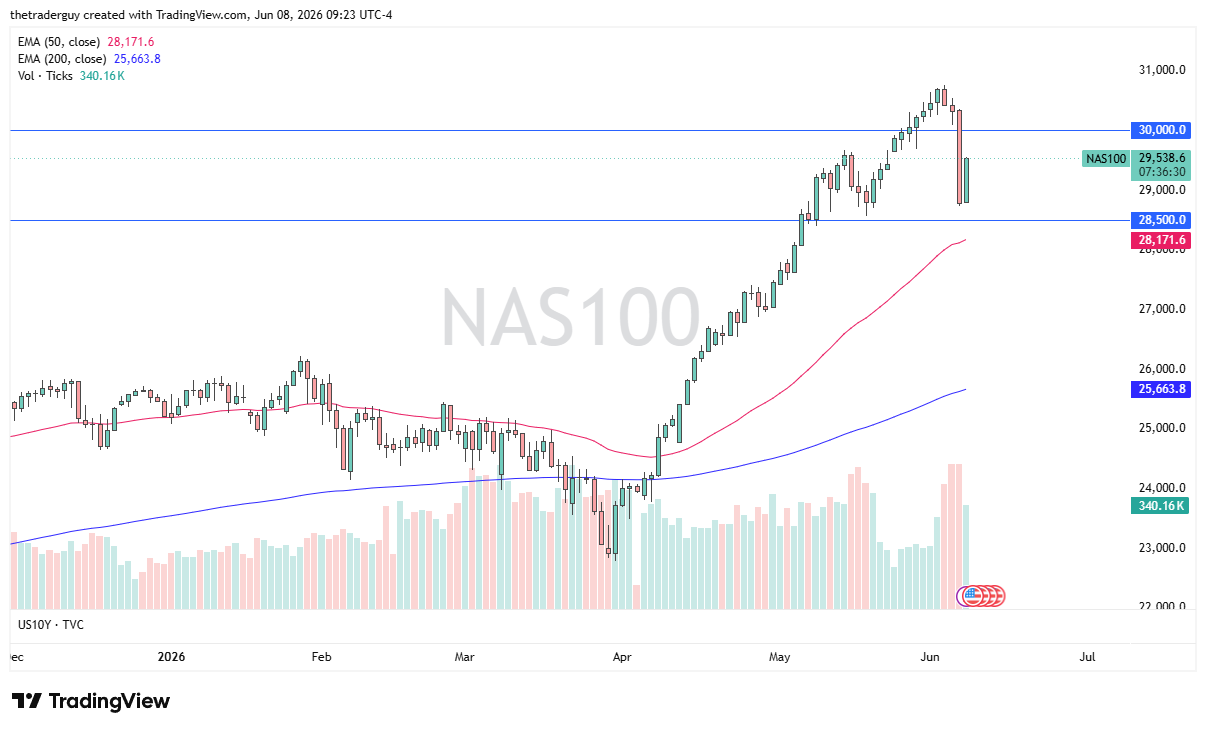
The Nasdaq 100 has ripped to the upside as interest rates in the United States have dipped a little bit, but quite frankly, I think a lot of what we’re looking at here is a reaction to the overreaction on Friday.
I believe that this market probably goes looking to the 30,000 level again, and it looks at this point in time, at least, like the 28,500 level will continue to offer a bit of support.
I have no interest in shorting this market. I fully admit that the Friday candlestick was horrific and it could be the beginning of something, but until we break down below the 50-day EMA, I’m not overly concerned.

Dow Jones 30 Technical Analysis
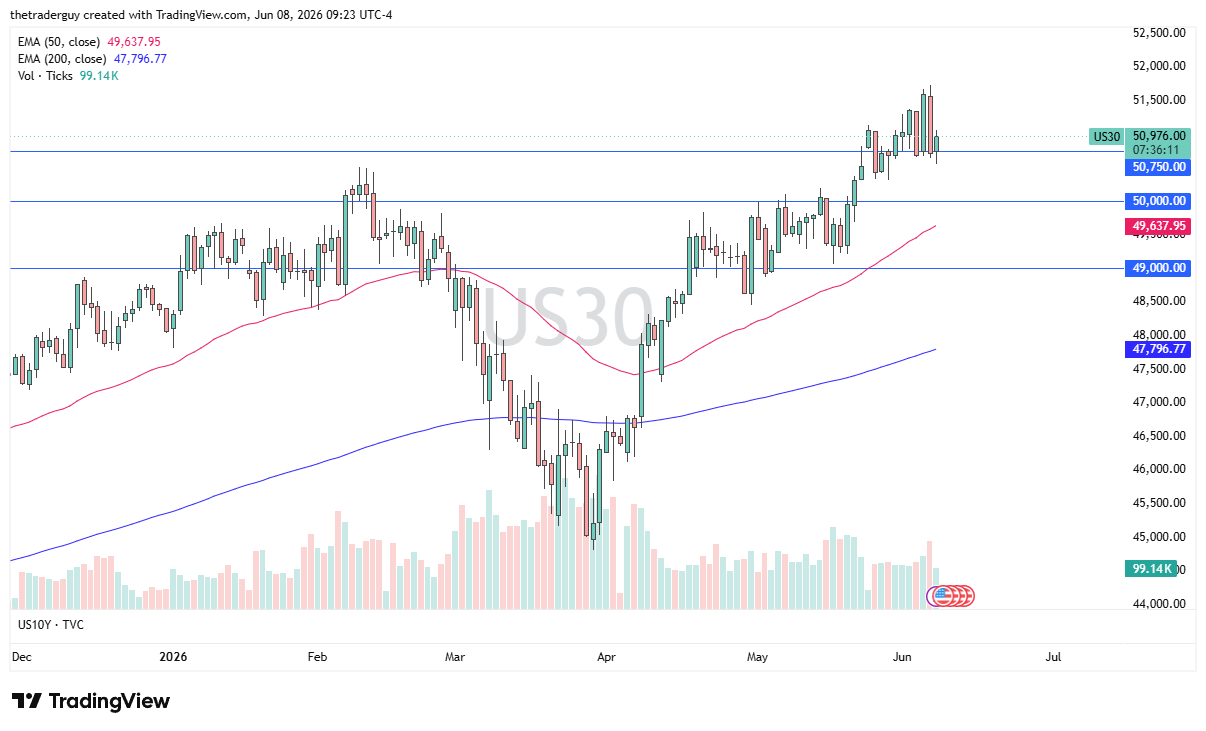
The Dow Jones 30 initially dipped below the 50,750 level but has since bounced quite nicely. It certainly looks like a market that is doing everything it can to sustain pressure to the upside. I think it does continue to consolidate in this area, perhaps heading towards the 51,500 level.
If it breaks down from here, then we would see the 50,000 dollars level more likely than not end up being a major support level.
NASDAQ 100 Price Forecast
Every new NASDAQ 100 analysis as it publishes, today's technical signal and key levels, live price — on one page.
See all NASDAQ 100 forecastsS&P 500 Technical Analysis
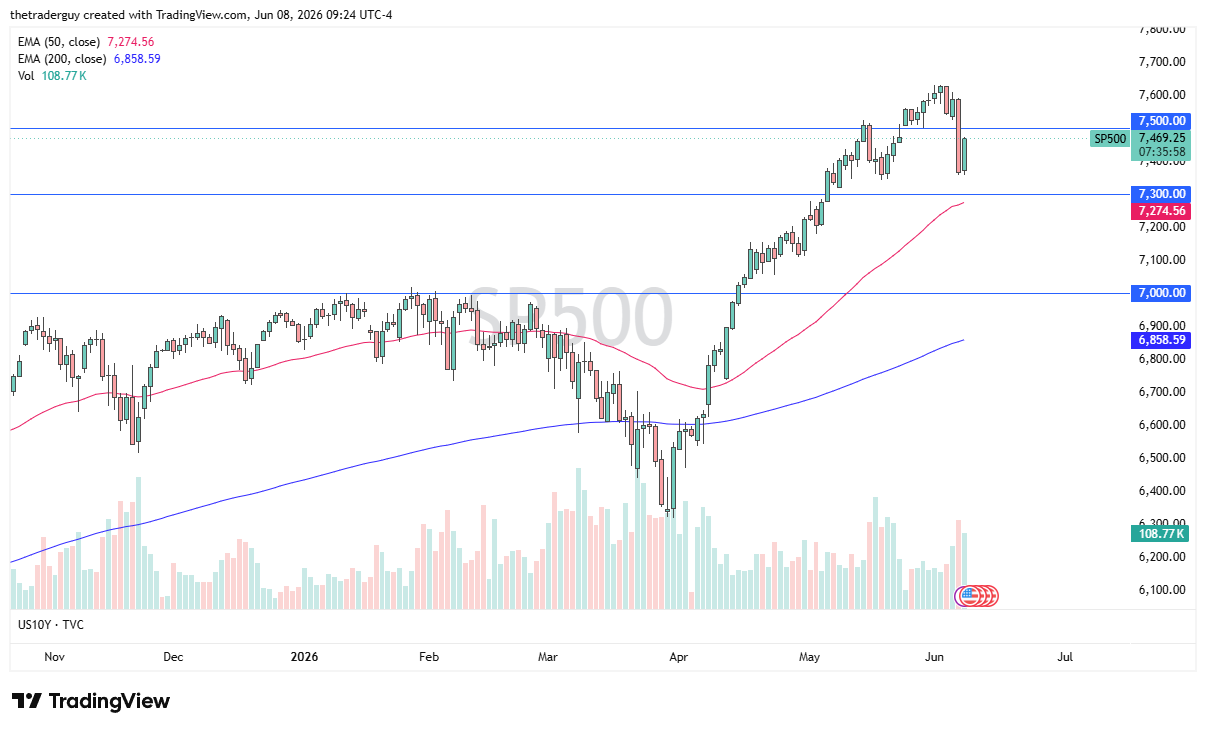
The S&P 500 looks like it’s going to challenge 7,500 pretty quickly. If we can break above there, that opens up the floodgates. The 7,300-level underneath continues to be support, especially with the 50-day EMA right there, but quite frankly, with those interest rates drifting a little lower in the United States, that should help the S&P 500 as well.
I’ve got no interest in shorting the US indices. I think a lot of foreign capital is going to continue to flow into New York and support some of these bigger names.
If you’d like to know more about chart patterns and how to trade them, please visit our educational area.